Open Access
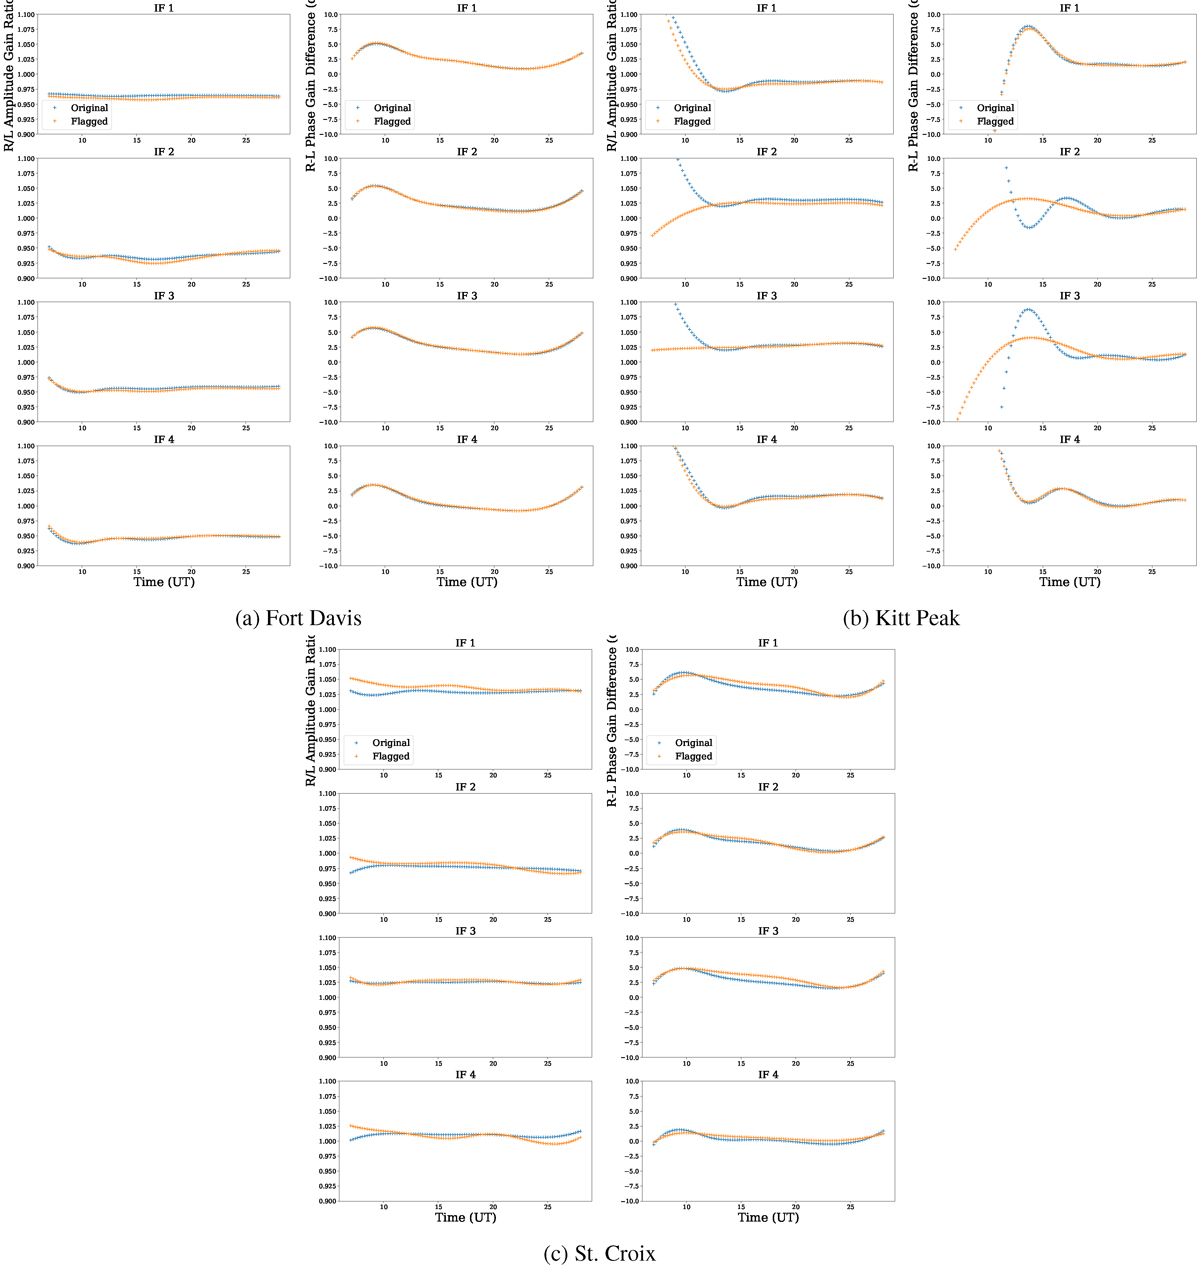
Fig. B.3.
Download original image
Smoothed R/L gain curves for three stations. Shown are the gain curves obtained for the original dataset (blue) and the curves obtained when the gain transfer techniques is only applied to datasets with the long baselines flagged.
Current usage metrics show cumulative count of Article Views (full-text article views including HTML views, PDF and ePub downloads, according to the available data) and Abstracts Views on Vision4Press platform.
Data correspond to usage on the plateform after 2015. The current usage metrics is available 48-96 hours after online publication and is updated daily on week days.
Initial download of the metrics may take a while.