Fig. 9
Download original image
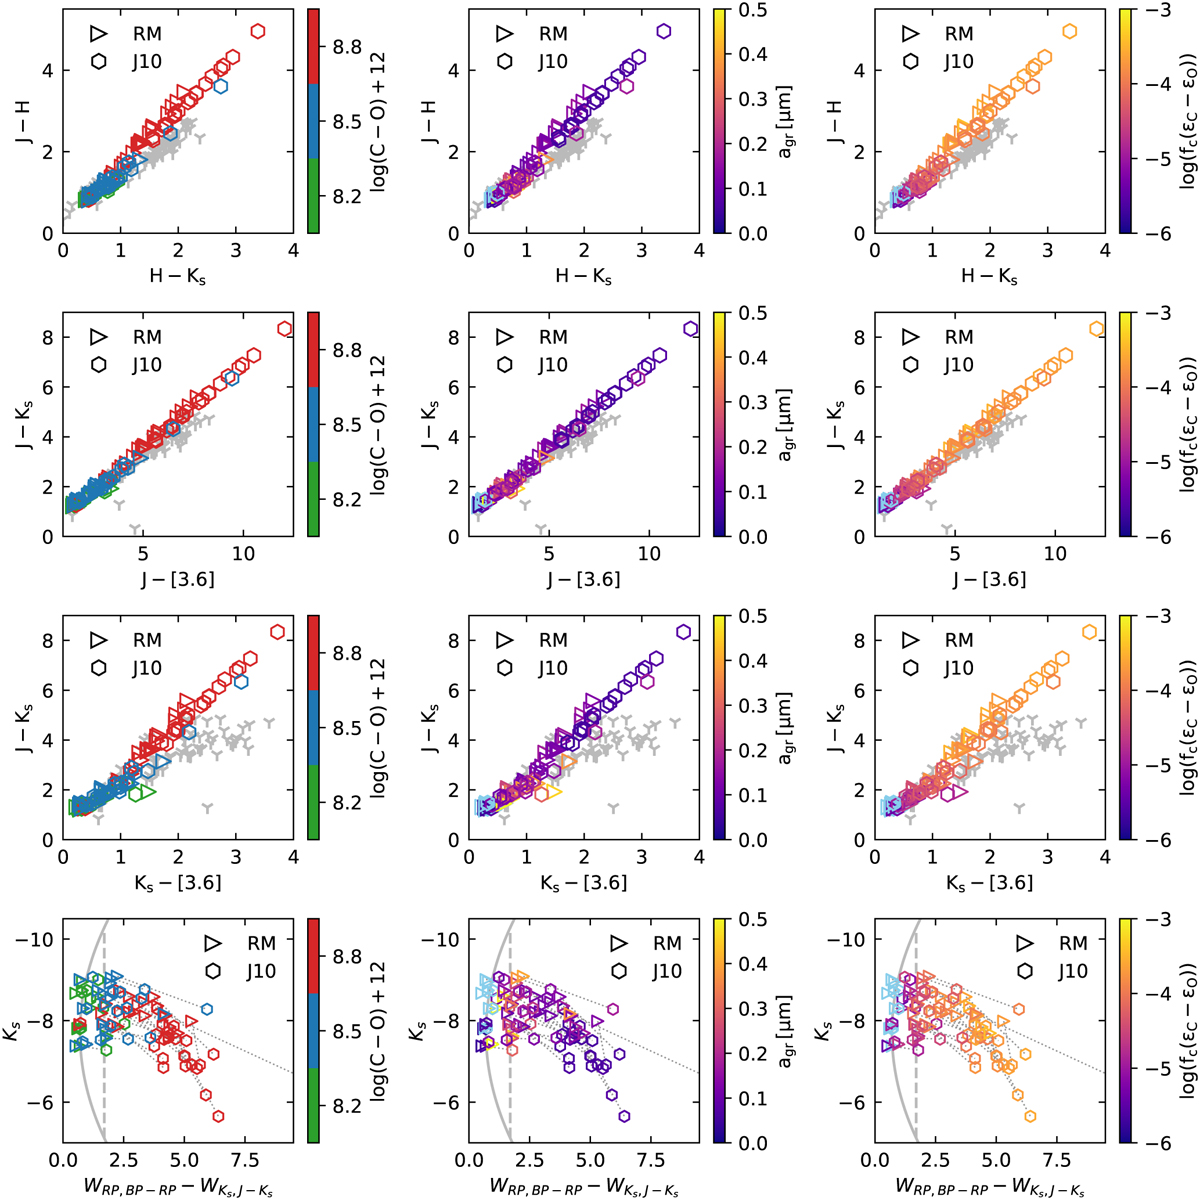
Colour-colour-diagrams (CCDs) given in rows 1–3, as well as a Gaia-2MASS diagram (see text for details). All three columns show the same model data, but colour-coded by different properties: carbon excess (input parameter; left column), resulting grain size (middle), and amount of dust (condensation degree times C – O abundance; right). Model symbols in light blue indicate models with no wind. Observations are plotted as grey symbols in the CCDs (top three rows), drawn from Jones et al. (2017).
Current usage metrics show cumulative count of Article Views (full-text article views including HTML views, PDF and ePub downloads, according to the available data) and Abstracts Views on Vision4Press platform.
Data correspond to usage on the plateform after 2015. The current usage metrics is available 48-96 hours after online publication and is updated daily on week days.
Initial download of the metrics may take a while.