Fig. 4
Download original image
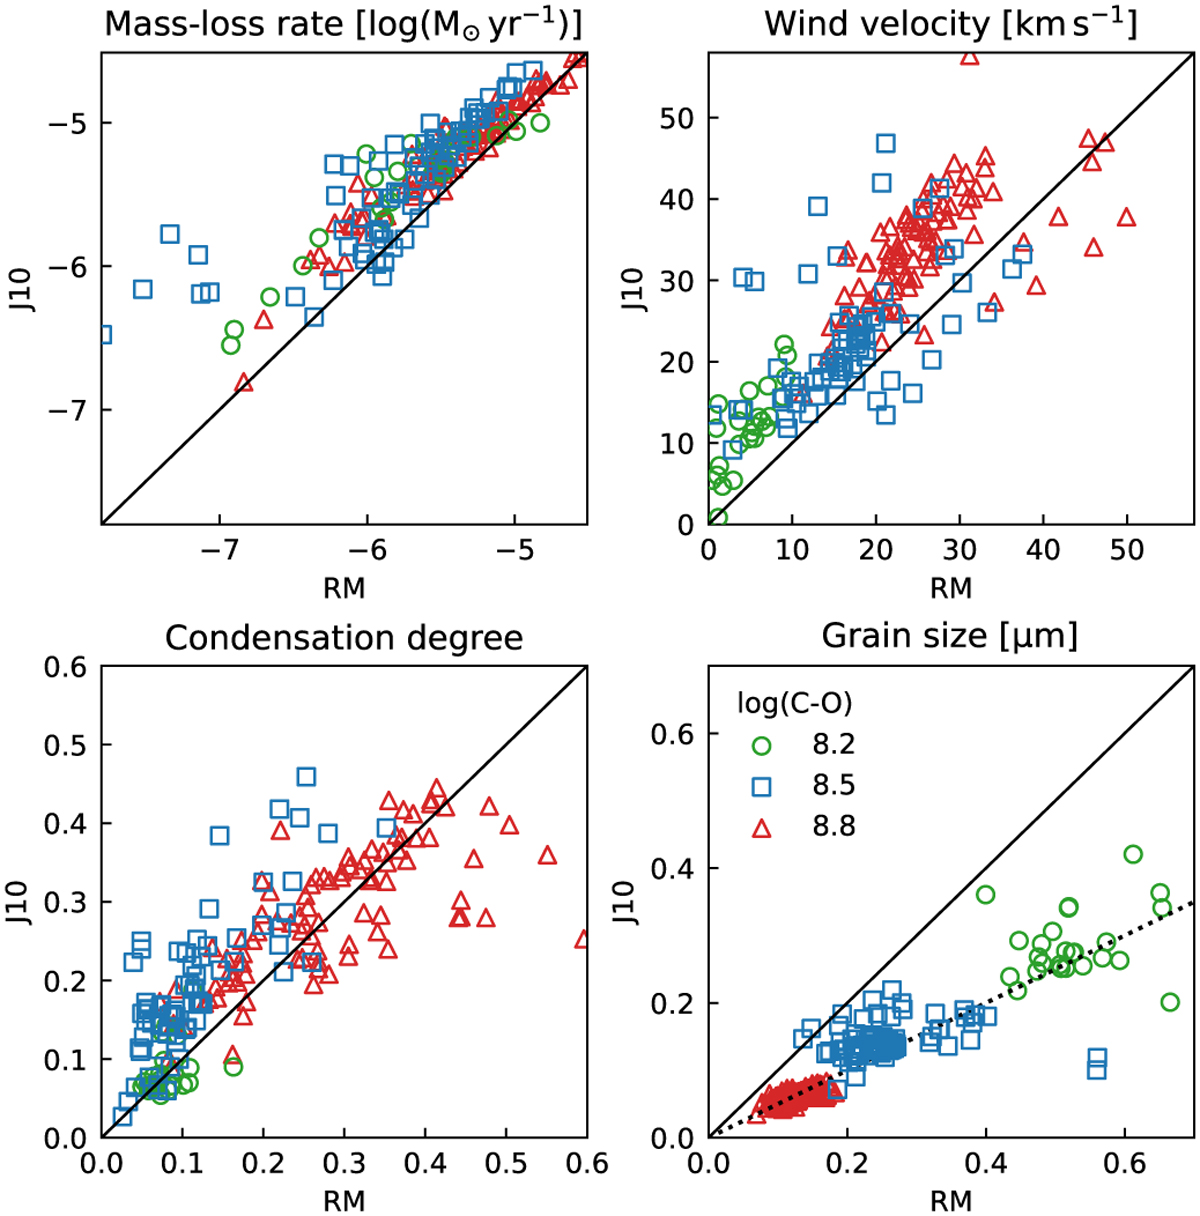
Comparison of wind and grain properties predicted by the models. The x-axis represent the results from models based on RM opacity data and the y-axis represent the results based on J10 opacity data. The colours indicate the amount of excess carbon (see legend in the bottom right panel). Only models with steady winds are depicted.
Current usage metrics show cumulative count of Article Views (full-text article views including HTML views, PDF and ePub downloads, according to the available data) and Abstracts Views on Vision4Press platform.
Data correspond to usage on the plateform after 2015. The current usage metrics is available 48-96 hours after online publication and is updated daily on week days.
Initial download of the metrics may take a while.