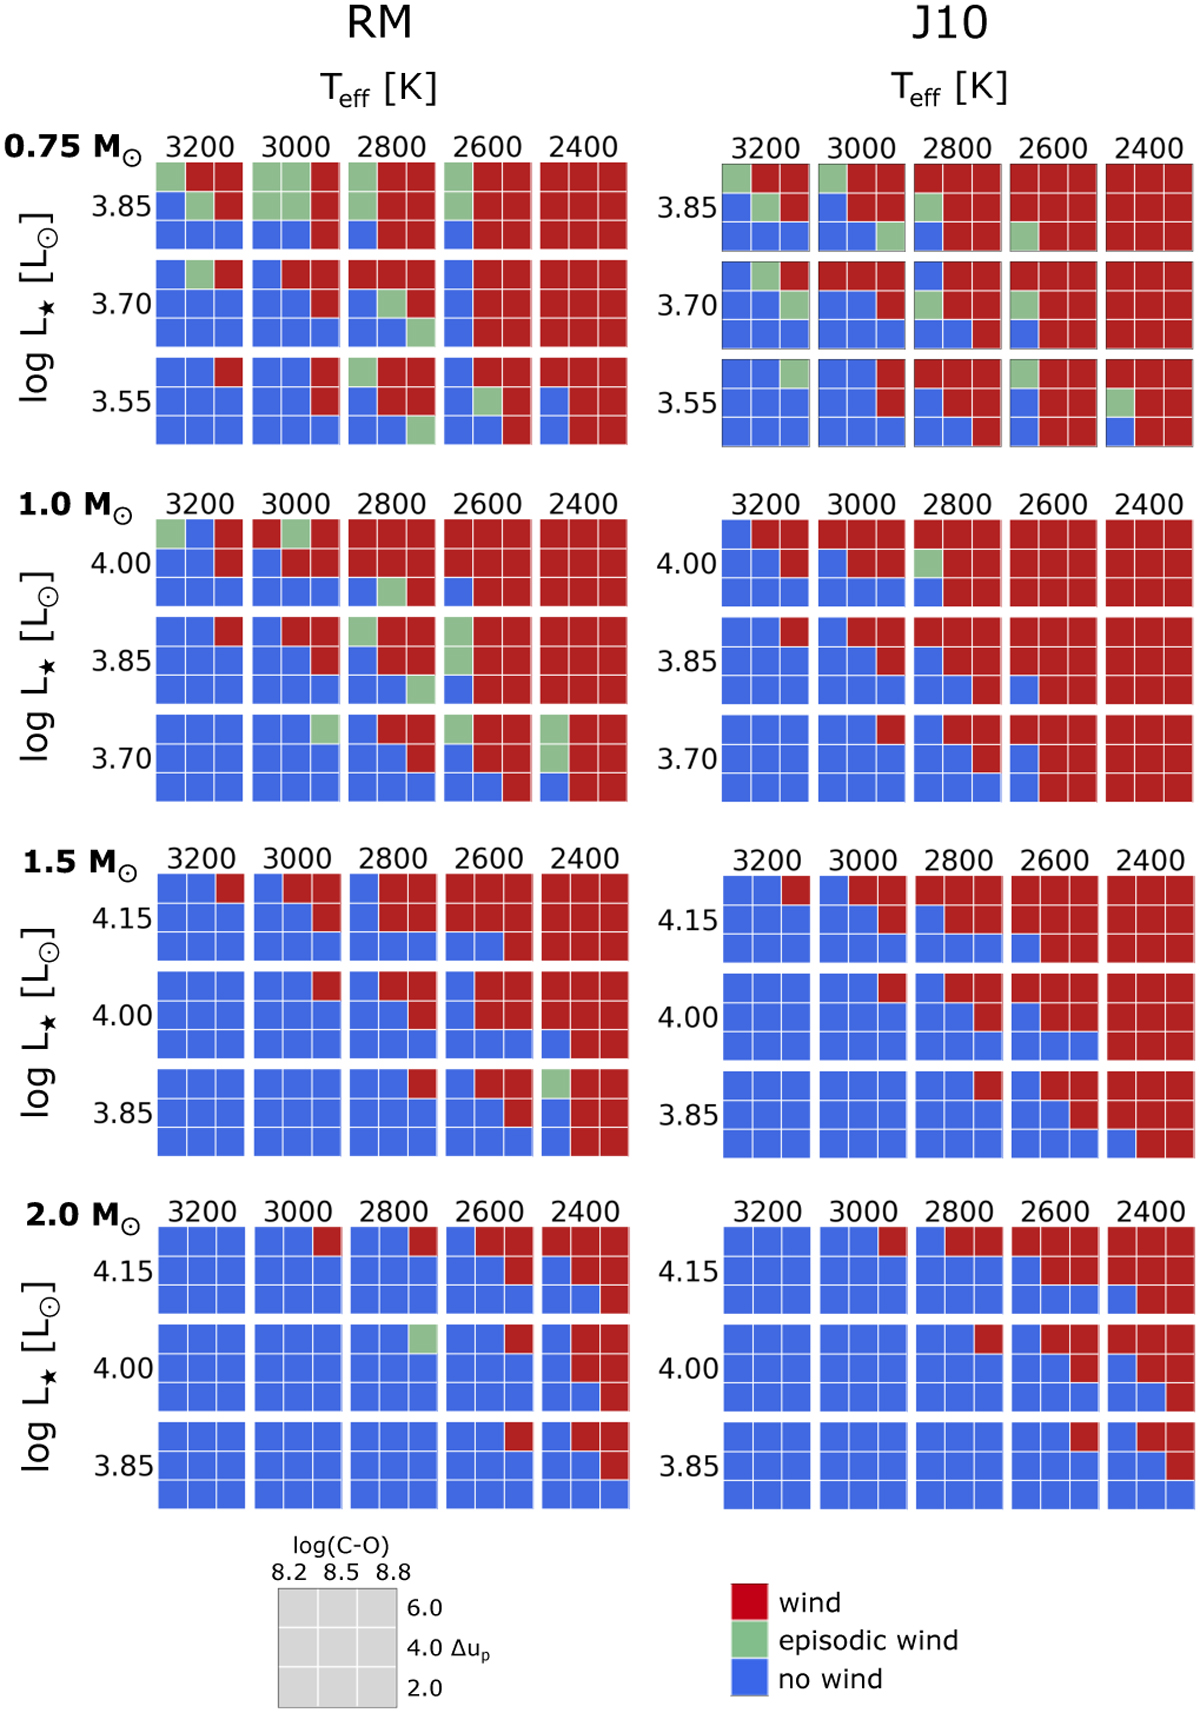
Fig. 3
Download original image
Schematic overview of the dynamic behaviour of the models as a function of input parameters. Left column: wind maps obtained with RM opacity data. Right column: wind maps with J10 opacity data. From top to bottom: wind maps for 0.75, 1.0, 1.5, and 2.0 solar masses. The colours represent dynamic behaviour, and each temperature and luminosity combination is further divided into squares indicating piston velocity, Δ up, and carbon excess, log(C − O). See bottom legend for details.
Current usage metrics show cumulative count of Article Views (full-text article views including HTML views, PDF and ePub downloads, according to the available data) and Abstracts Views on Vision4Press platform.
Data correspond to usage on the plateform after 2015. The current usage metrics is available 48-96 hours after online publication and is updated daily on week days.
Initial download of the metrics may take a while.