Fig. 2
Download original image
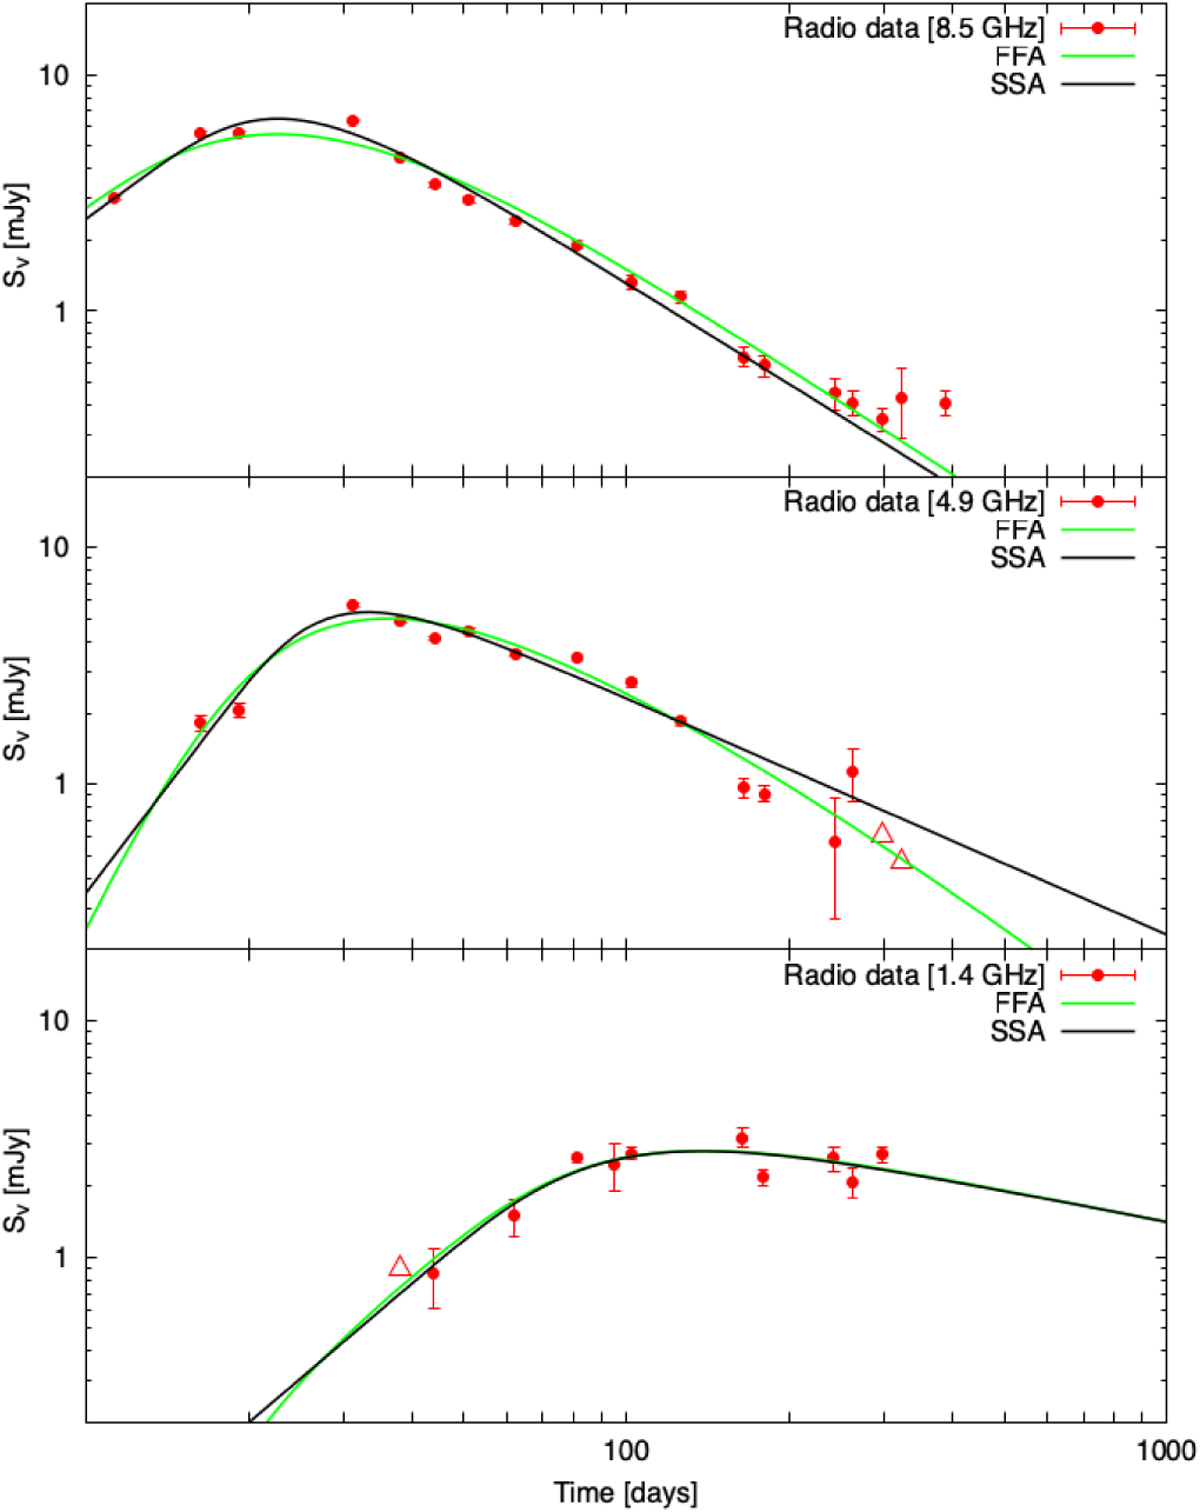
Radio LCs of SN 2004gq at 8.5 GHz (top panel), at 4.9 GHz (middle panel), and at 1.4 GHz (bottom panel). The red dots show the observational data at the specified frequency, and the red triangles show the upper limits of the observations, which were not included in the model fits. The green lines represent the best-fit “pure” thermal FFA model, and the black lines represent the best-fit “pure” nonthermal SSA.
Current usage metrics show cumulative count of Article Views (full-text article views including HTML views, PDF and ePub downloads, according to the available data) and Abstracts Views on Vision4Press platform.
Data correspond to usage on the plateform after 2015. The current usage metrics is available 48-96 hours after online publication and is updated daily on week days.
Initial download of the metrics may take a while.