Open Access
Fig. 1
Download original image
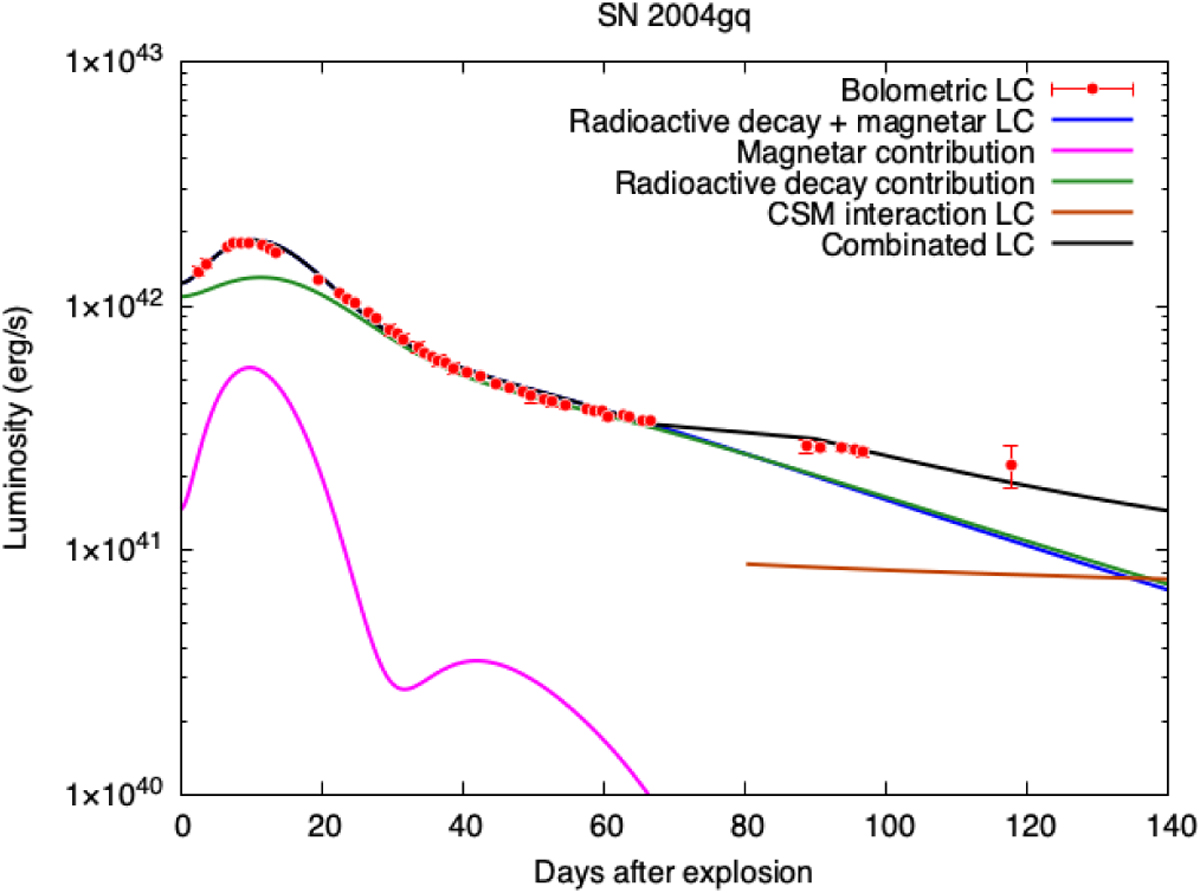
Comparison of the quasi-bolometric LC of SN 2004gq (red dots) with best-fit model data. The orange and blue curves represent the contribution of the CSM interaction and the photon-diffusion model, respectively, while the black lines show the combined LCs.
Current usage metrics show cumulative count of Article Views (full-text article views including HTML views, PDF and ePub downloads, according to the available data) and Abstracts Views on Vision4Press platform.
Data correspond to usage on the plateform after 2015. The current usage metrics is available 48-96 hours after online publication and is updated daily on week days.
Initial download of the metrics may take a while.