Fig. 9
Download original image
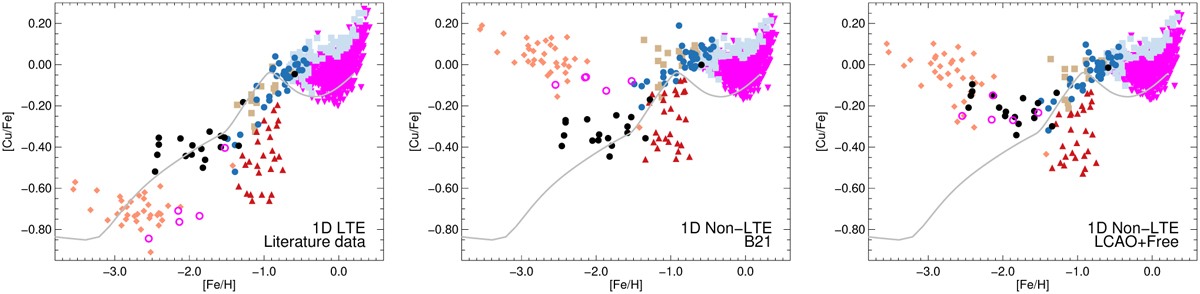
[Cu/Fe] versus [Fe/H]. The left panel shows the LTE abundances from the literature, while the middle and right panels show non-LTE abundances using the hydrogen collision data from Belyaev et al. (2021) and our newly calculated LCAO+Free data, respectively. We again overplotted the same GCE model from Kobayashi et al. (2020). Literature data from: Delgado Mena et al. (2017) (dwarfs and subgiants in the thin disc as magenta downwards triangles; thick disc and high-alpha metal-rich disc as light blue squares); Yan et al. (2016) (dwarfs and subgiants in the thick disc as tan squares; high-alpha halo as dark blue circles; low-alpha halo as upwards red triangles); Korotin et al. (2018) (metal-poor dwarfs as magenta open circles); Sneden et al. (2023) (metal-poor dwarfs as light red diamonds); and Caffau et al. (2023) (metal-poor giants as black filled circles).
Current usage metrics show cumulative count of Article Views (full-text article views including HTML views, PDF and ePub downloads, according to the available data) and Abstracts Views on Vision4Press platform.
Data correspond to usage on the plateform after 2015. The current usage metrics is available 48-96 hours after online publication and is updated daily on week days.
Initial download of the metrics may take a while.