Fig. 7
Download original image
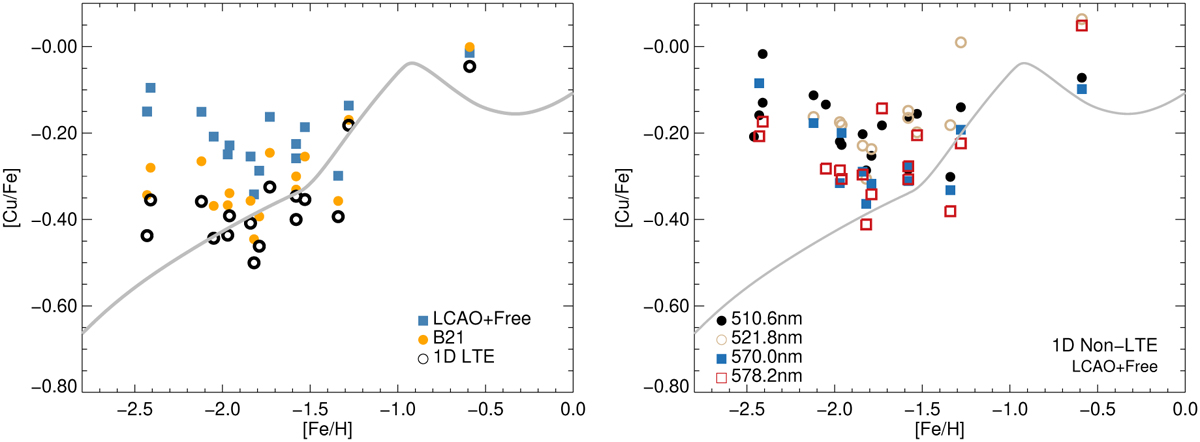
[Cu/Fe] versus [Fe/H] for the metal-poor giants from the Caffau et al. (2023) sample, with the GCE model from Kobayashi et al. (2020) overplotted in each panel. Left panel: line-averaged abundances in LTE and in non-LTE with Cu + H collision data from the present calculation (LCAO + Free) and from Belyaev et al. (2021) (B21). Right panel: line-by-line non-LTE abundances based on the Cu + H collision data from the LCAO + Free model.
Current usage metrics show cumulative count of Article Views (full-text article views including HTML views, PDF and ePub downloads, according to the available data) and Abstracts Views on Vision4Press platform.
Data correspond to usage on the plateform after 2015. The current usage metrics is available 48-96 hours after online publication and is updated daily on week days.
Initial download of the metrics may take a while.