Fig. 6
Download original image
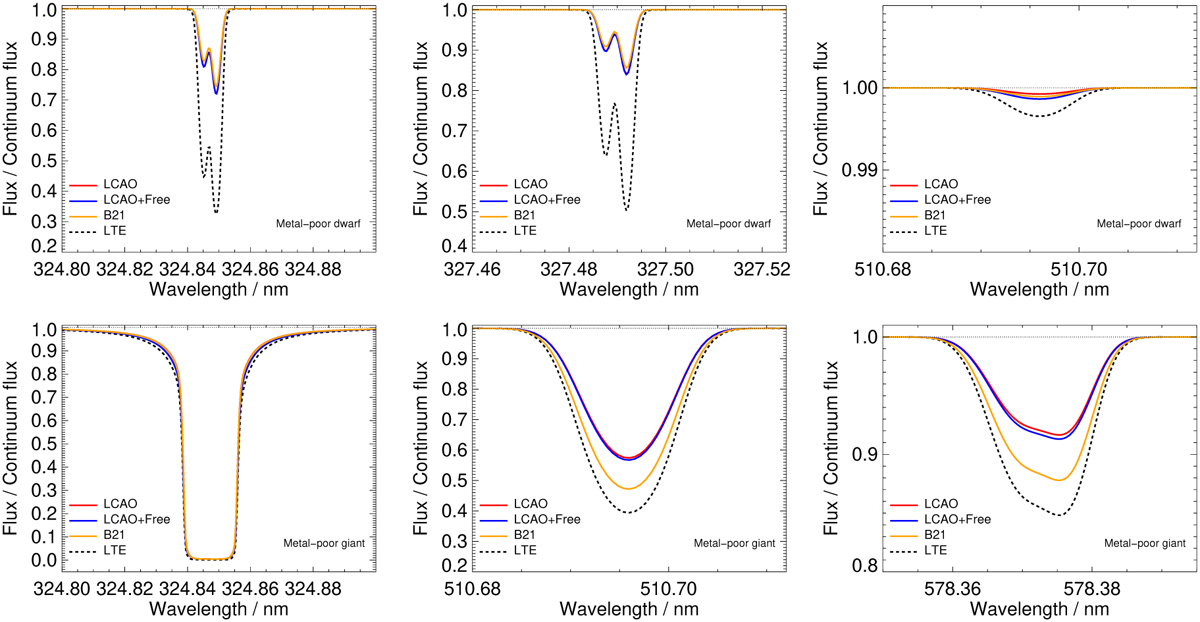
Comparison of LTE (dashed black line) and non-LTE (solid lines) modelling for the 324.8, 327.4, 510.6 and 578.2 nm Cu I lines in a metal-poor dwarf (top four panels) and a metal-poor giant (bottom four panels). The impact of different Cu + H collision data on the non-LTE profiles is shown, with red and blue lines using newly calculated rates, while the orange line represents rates from Belyaev et al. (2021). No macroscopic broadening (macroturbulence, instrumental, and rotational broadening) was added to the lines.
Current usage metrics show cumulative count of Article Views (full-text article views including HTML views, PDF and ePub downloads, according to the available data) and Abstracts Views on Vision4Press platform.
Data correspond to usage on the plateform after 2015. The current usage metrics is available 48-96 hours after online publication and is updated daily on week days.
Initial download of the metrics may take a while.