Fig. 10
Download original image
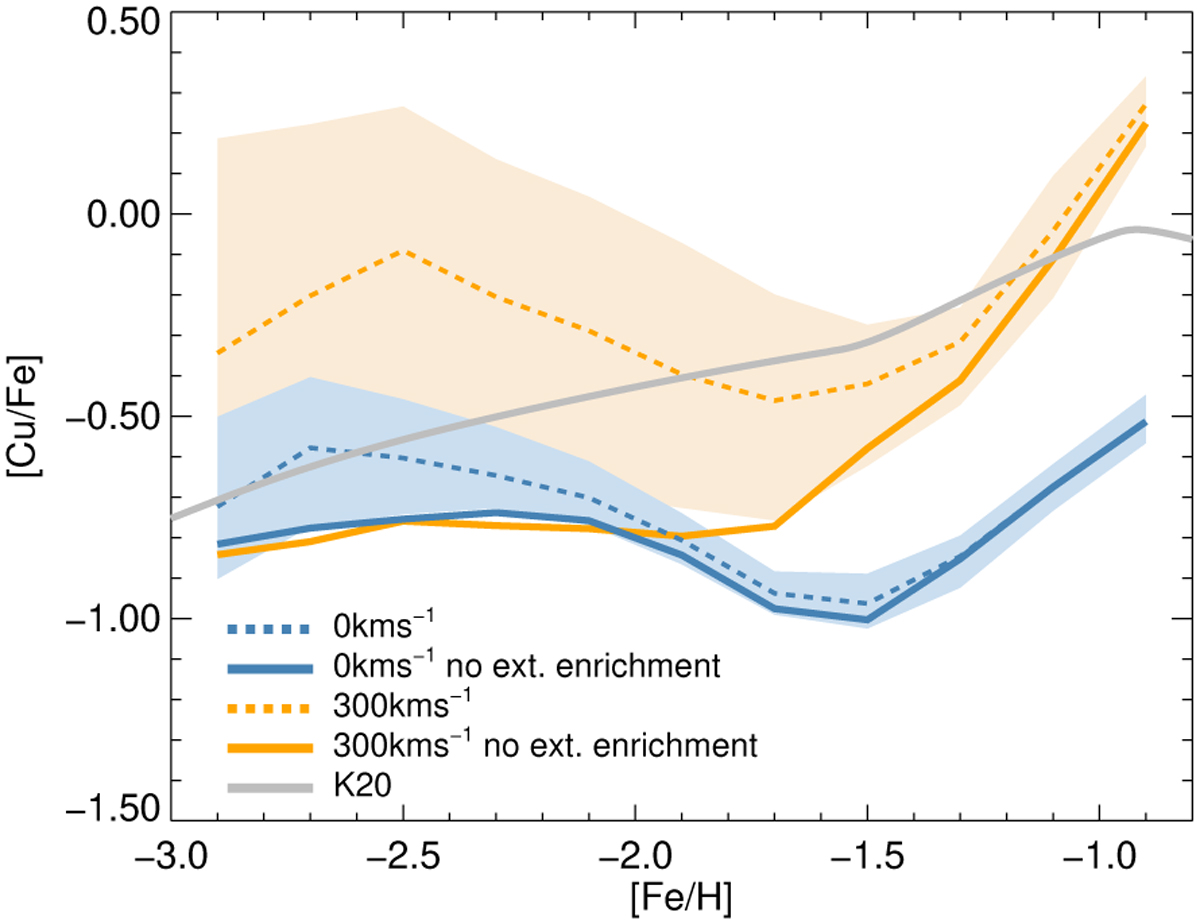
NEFERTITI models using Population II yields from massive stars with two different rotation velocities (Limongi & Chieffi 2018). The dotted lines and shaded areas represent the median and 25 and 75 percentiles of all stars in the model. The full lines represent the same models but only considering stars that formed in environments dominated by internal enrichment (no external enrichment case). The blue and orange colours are for the models using the non-rotating (v = 0 km/s) and fast-rotating yields (v = 300 km/s), respectively. The grey line is the GCE model from Kobayashi et al. (2020).
Current usage metrics show cumulative count of Article Views (full-text article views including HTML views, PDF and ePub downloads, according to the available data) and Abstracts Views on Vision4Press platform.
Data correspond to usage on the plateform after 2015. The current usage metrics is available 48-96 hours after online publication and is updated daily on week days.
Initial download of the metrics may take a while.