Open Access
Fig. A.3.
Download original image
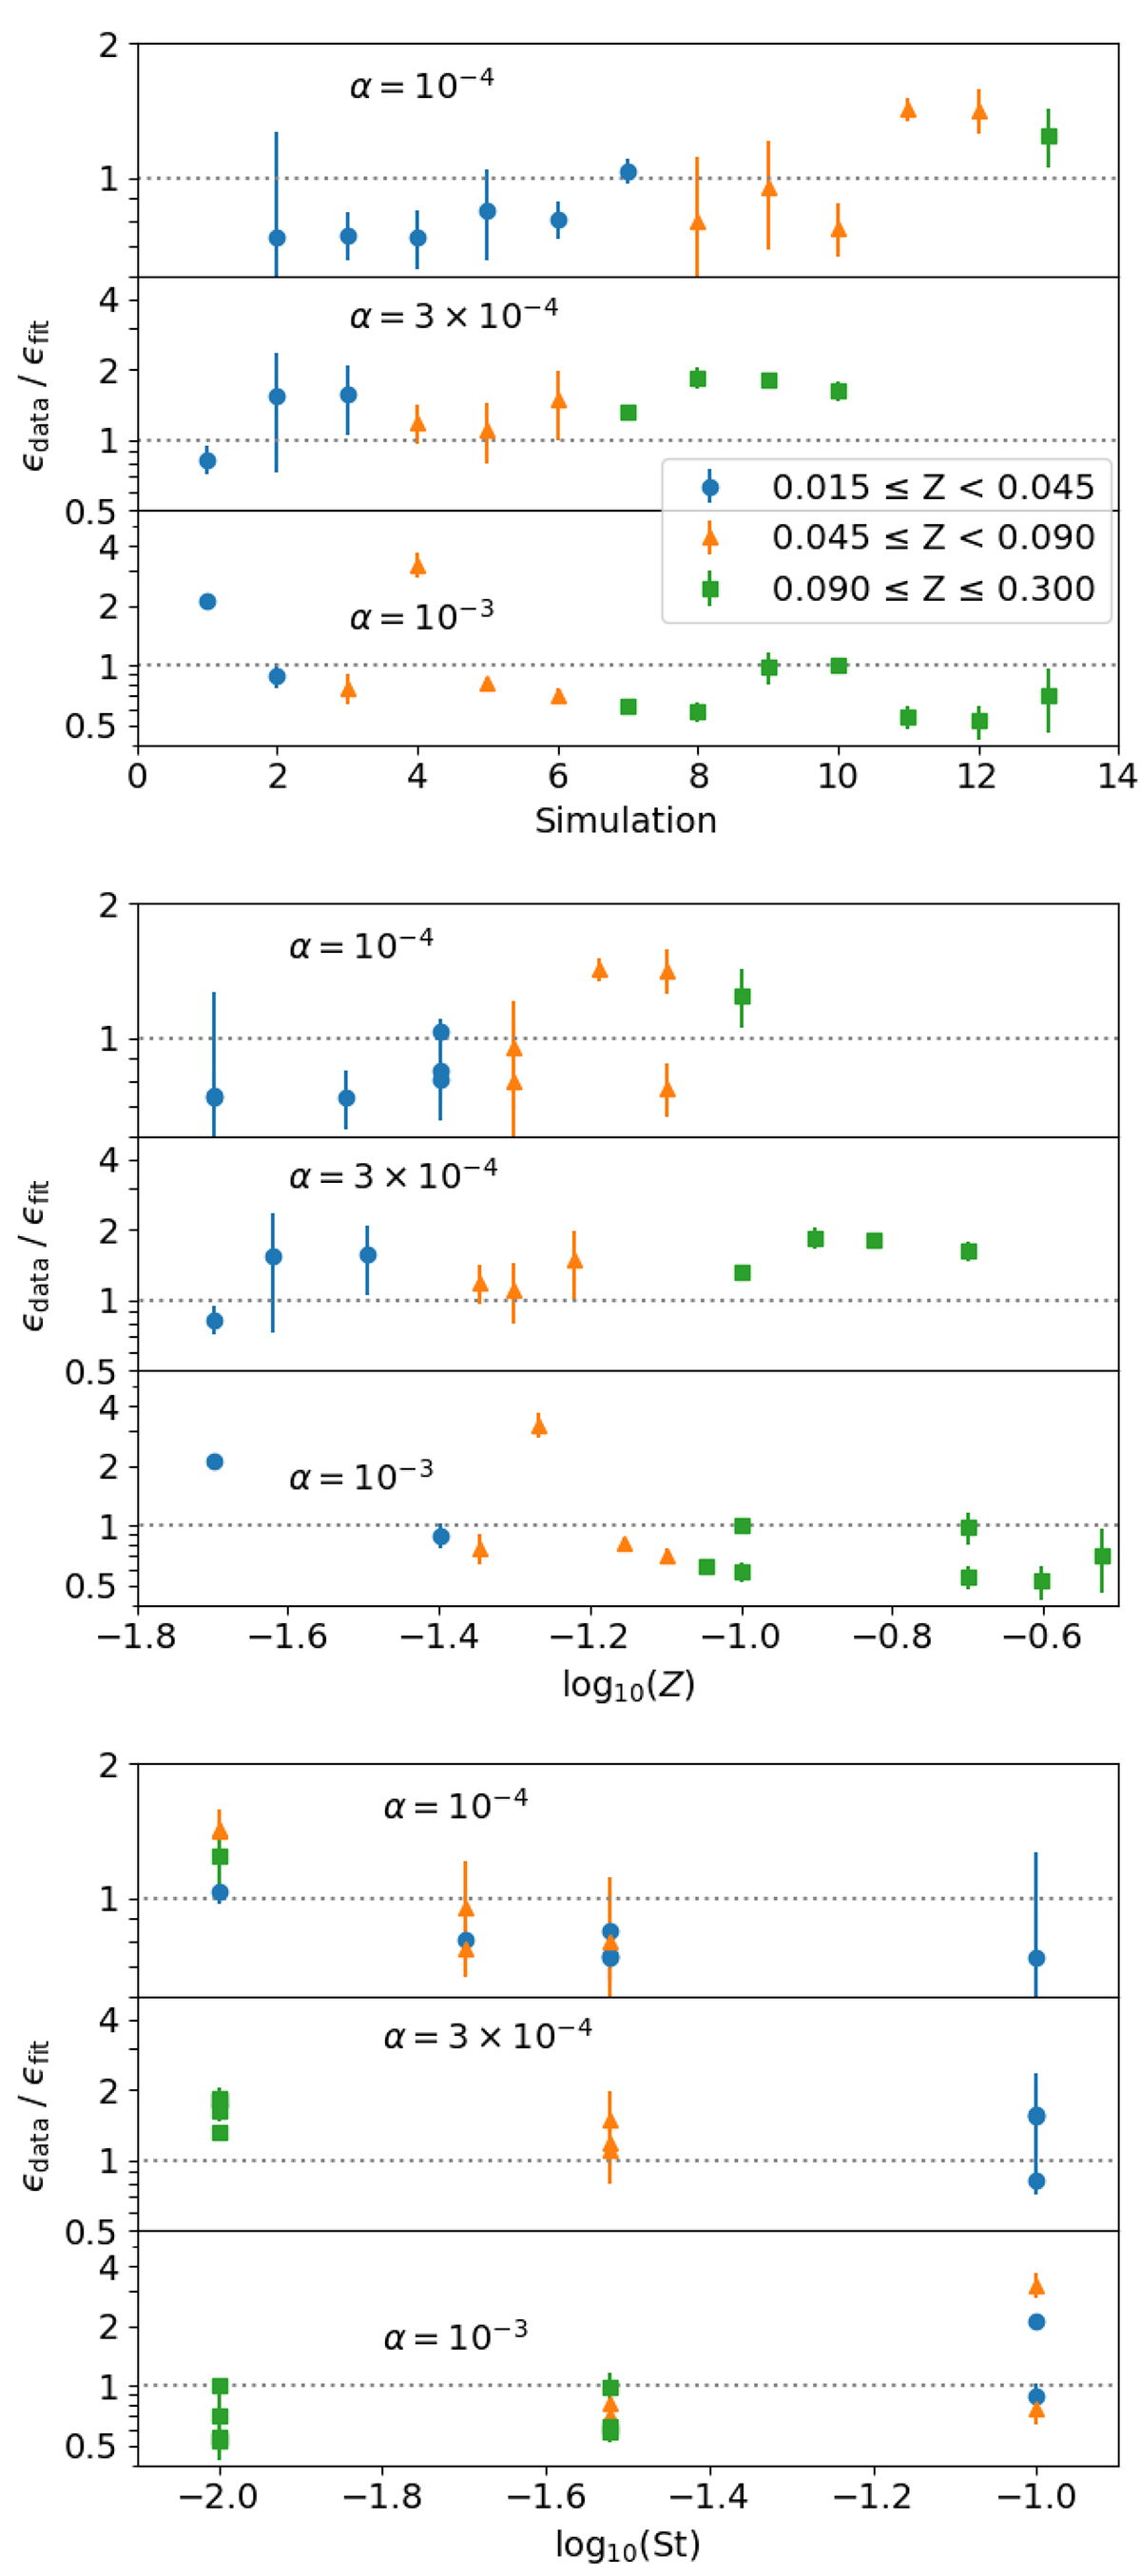
Our {⟨ϵSI⟩t} dataset divided across α (top to bottom) and across Z (see inset for color-coding). We plot the ratio (ϵdata/ϵfit) of the dataset vs the fit in Eq. 2. A perfect fit would mean ϵdata/ϵfit = 1. The error bars are σϵdata/ϵdata, where σϵdata is the standard deviation of the time series.
Current usage metrics show cumulative count of Article Views (full-text article views including HTML views, PDF and ePub downloads, according to the available data) and Abstracts Views on Vision4Press platform.
Data correspond to usage on the plateform after 2015. The current usage metrics is available 48-96 hours after online publication and is updated daily on week days.
Initial download of the metrics may take a while.