Fig. 6.
Download original image
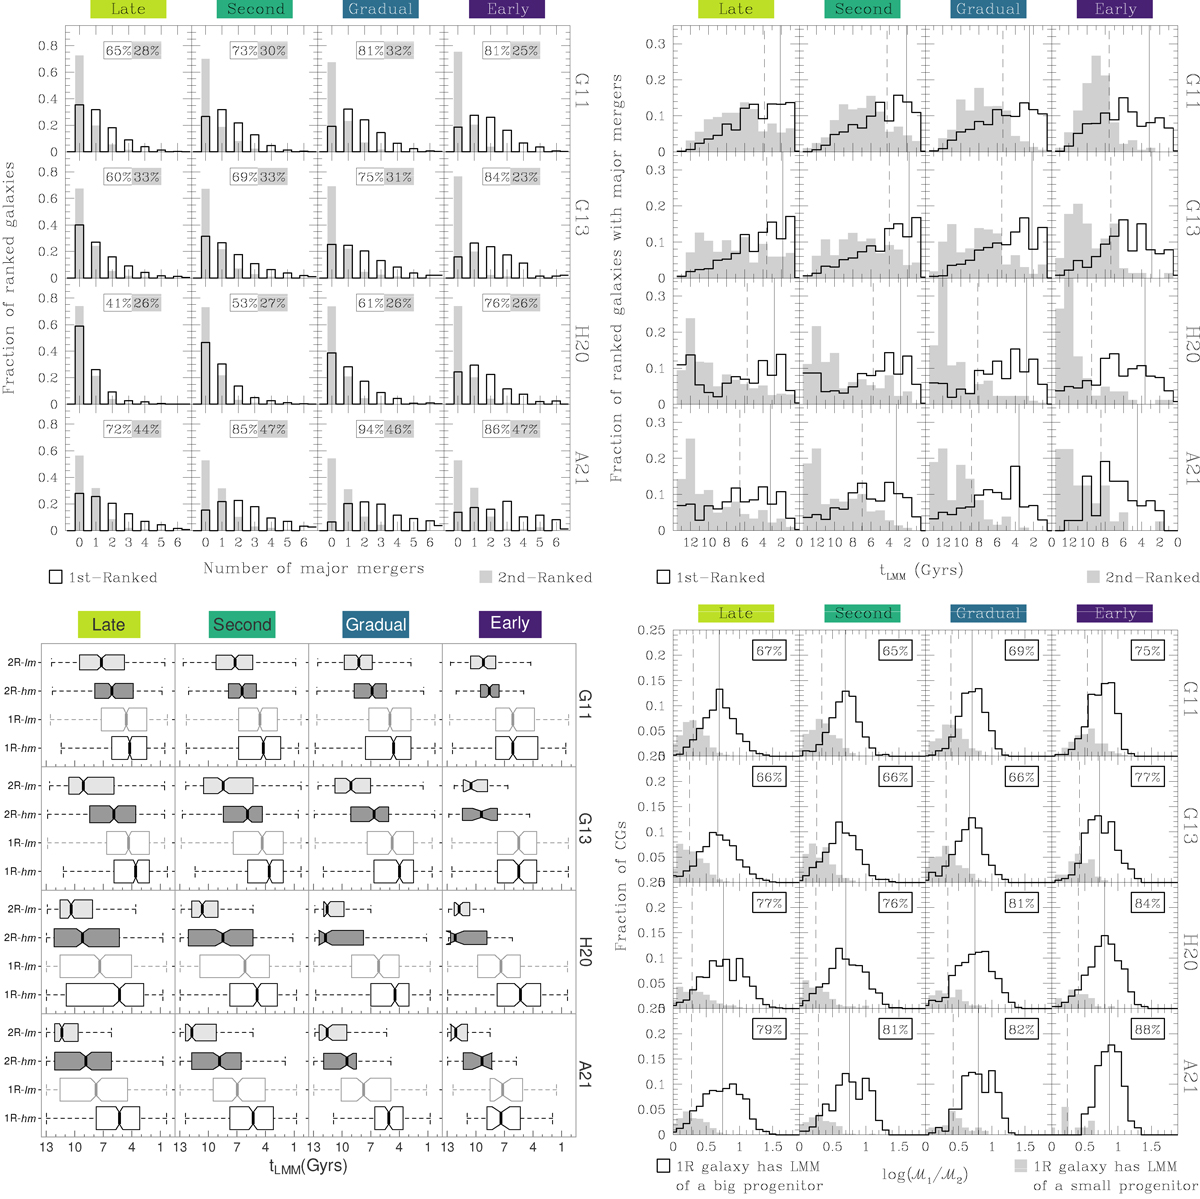
Major merger events in the two first-ranked galaxies in CGs as a function of the assembly channel. Top-left plot: Fraction of ranked galaxies with major merger events at z = 0 as a function of the number of those events. Inset numeric labels indicate the percentage of ranked galaxies that have experienced at least one major merger event. Top-right plot: Distribution of the time of the LMM, denoted as tLMM for the ranked galaxies with major mergers. Solid (1R) and dashed (2R) vertical lines indicate the time at which 80% of the galaxy sample already had their LMM. Bottom-left panel: Boxplots of the tLMM for the 1R and 2R galaxy samples are presented, divided into high and low stellar mass bins (hm and lm) based on whether their stellar masses are above or below the corresponding median mass value. Bottom-right plot: Fraction of CGs with big progenitor at the LMM of the 1R or small progenitor at the LMM of the 1R as a function of the stellar mass gap between the 1R and 2R galaxy at z = 0. The vertical lines indicate the median values for the distribution of 1R galaxies with big and small progenitors. The inset labels in each panel indicate the percentage of 1R galaxies with a LMM due to a big progenitor.
Current usage metrics show cumulative count of Article Views (full-text article views including HTML views, PDF and ePub downloads, according to the available data) and Abstracts Views on Vision4Press platform.
Data correspond to usage on the plateform after 2015. The current usage metrics is available 48-96 hours after online publication and is updated daily on week days.
Initial download of the metrics may take a while.