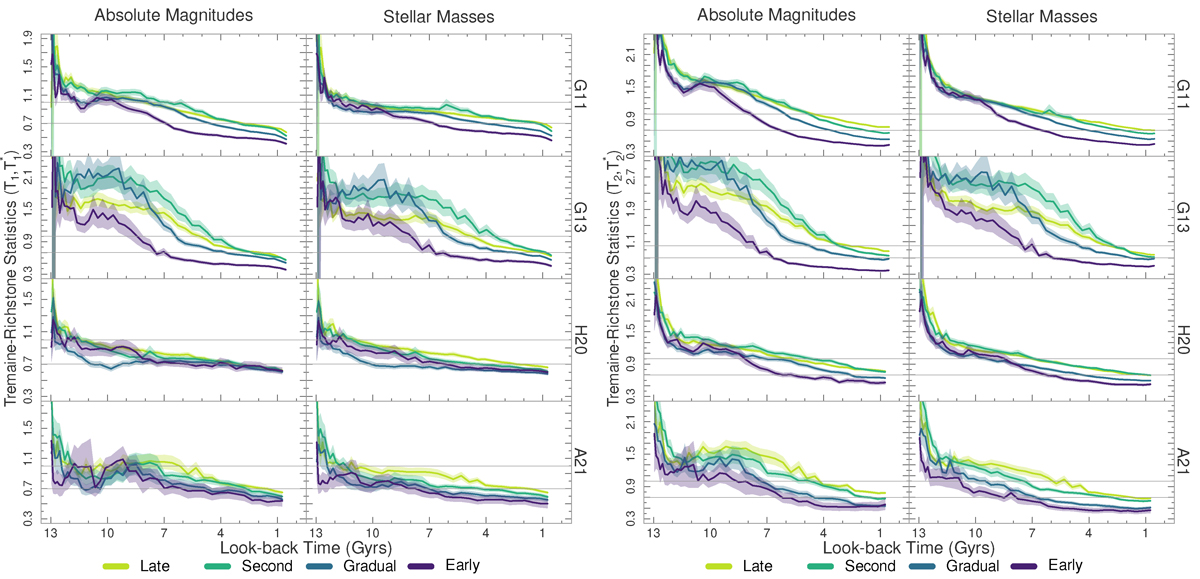
Fig. 5.
Download original image
Evolution of the TR statistics as a function of look-back time for CGs split by their assembly channels in each SAM. The statistics are computed using the properties of the two first-ranked galaxies selected at z = 0. The left plots display the statistics T1 (first column) and T1* (second column), while the right plots show T2 (first column) and T2*(second column). Error bars are computed using the bootstrap resampling technique. Horizontal solid lines indicate the reference values of 1 and 0.7 for the statistics.
Current usage metrics show cumulative count of Article Views (full-text article views including HTML views, PDF and ePub downloads, according to the available data) and Abstracts Views on Vision4Press platform.
Data correspond to usage on the plateform after 2015. The current usage metrics is available 48-96 hours after online publication and is updated daily on week days.
Initial download of the metrics may take a while.