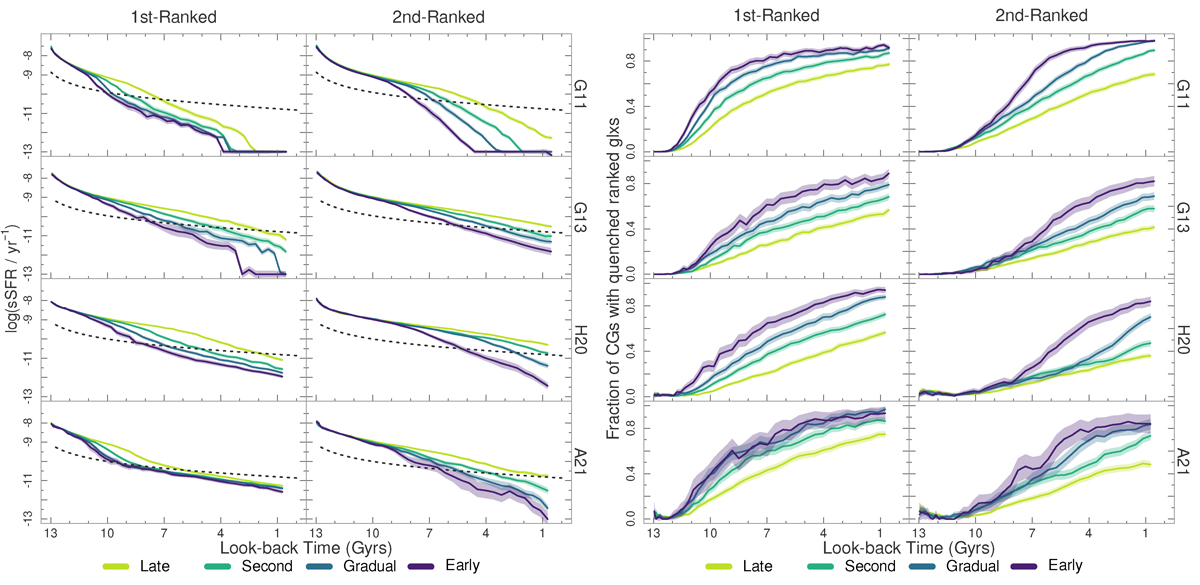
Fig. 4.
Download original image
Evolution of the specific star formation rate in the two first-ranked galaxies in CGs as a function of the CG assembly channel. Left plot: Time evolution of the median sSFR for the ranked galaxies in CGs. The black dashed curve indicates the transition to a quenched state (see text). Right plot: The time evolution of the fraction of CGs with quenched ranked galaxies. For both plots, error bars are computed as in Fig. 3.
Current usage metrics show cumulative count of Article Views (full-text article views including HTML views, PDF and ePub downloads, according to the available data) and Abstracts Views on Vision4Press platform.
Data correspond to usage on the plateform after 2015. The current usage metrics is available 48-96 hours after online publication and is updated daily on week days.
Initial download of the metrics may take a while.