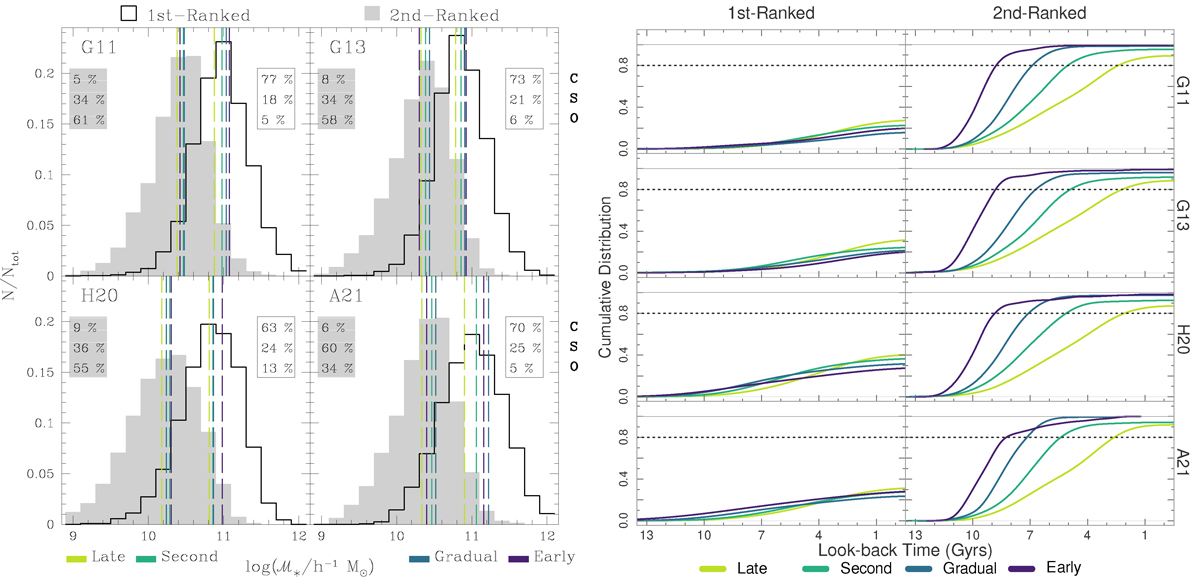
Fig. 2.
Download original image
Basic properties of the two first-ranked galaxies by stellar mass in CGs. Left plot: Stellar mass distribution for the two first-ranked galaxies in CGs at z = 0 for each SAM. Vertical dashed lines indicate the median stellar masses for the samples split according to the CG assembly channel. Inset numeric labels indicate the percentage of different types of galaxies (C: central, S: satellite, O: orphan) for each ranked galaxy sample. Right plot: Cumulative distribution of the look-back times at which the different ranked galaxies have undergone a galaxy-type transition from central to satellite/orphan. Solid and dashed horizontal lines at 1 and 0.8, respectively, are included as references.
Current usage metrics show cumulative count of Article Views (full-text article views including HTML views, PDF and ePub downloads, according to the available data) and Abstracts Views on Vision4Press platform.
Data correspond to usage on the plateform after 2015. The current usage metrics is available 48-96 hours after online publication and is updated daily on week days.
Initial download of the metrics may take a while.