Fig. 1.
Download original image
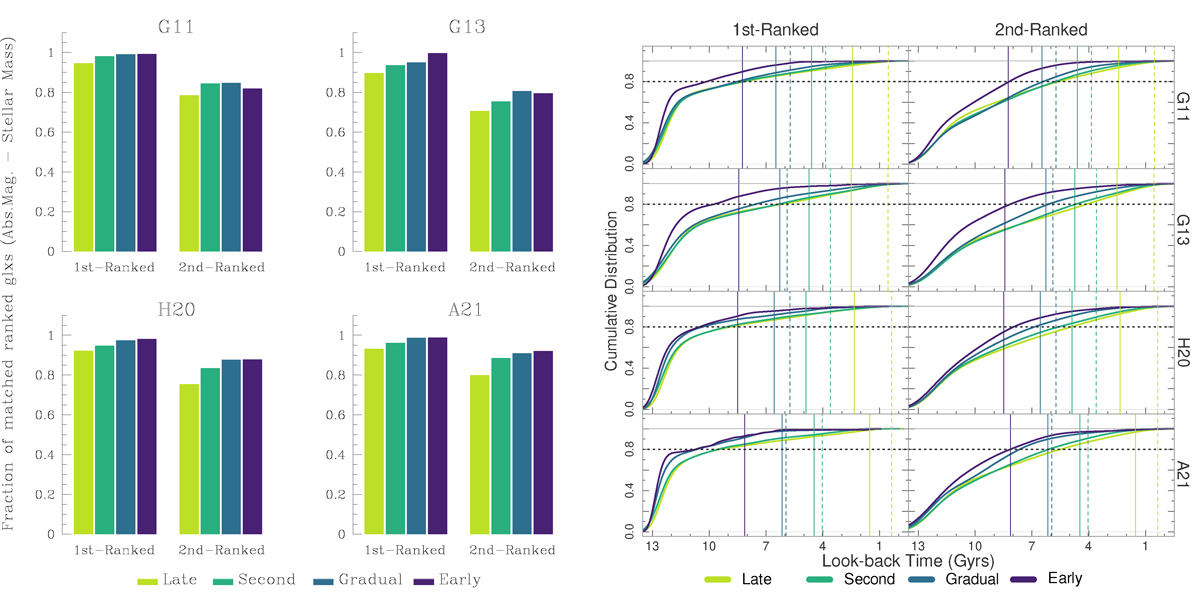
Preliminary comparison between the two first-ranked galaxies in CGs selected at z = 0. Left plots: Fraction of the two first-ranked galaxies in CGs whose rankings in absolute magnitude and stellar mass match. The bar plots are shown as a function of the SAMs and the assembly channels of their CG hosts. Right plots: Cumulative distributions of look-back times since the two first-ranked galaxies selected by stellar mass at z = 0 achieved their current ranking (only CG members at z = 0 are used). Each distribution is shown as a function of the assembly channel of the host CG. Vertical solid lines represent the median time for the two first-ranked galaxies to be considered under mutual gravitational interaction. Dashed lines indicate the median first pericenter time of the last-arriving CG member (key galaxy).
Current usage metrics show cumulative count of Article Views (full-text article views including HTML views, PDF and ePub downloads, according to the available data) and Abstracts Views on Vision4Press platform.
Data correspond to usage on the plateform after 2015. The current usage metrics is available 48-96 hours after online publication and is updated daily on week days.
Initial download of the metrics may take a while.