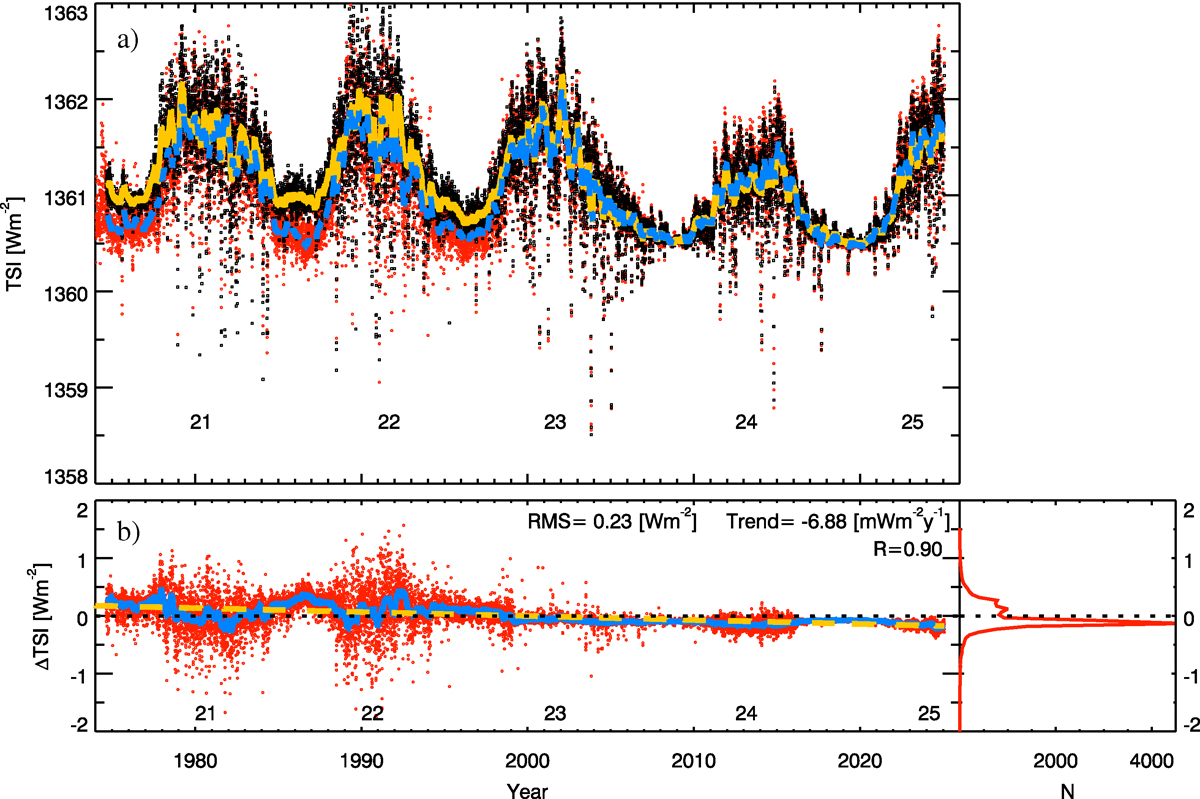
Fig. 8.
Download original image
Top: Updated SATIRE-S TSI composite (red dots for daily values and thick blue line for 180-day running means) in comparison to the earlier version by Yeo et al. (2014) (black dots for daily values and thick yellow line for 180-day running means). Bottom: Difference between the Yeo et al. (2014) and updated versions. Daily values are given by the red dots and the 180-day running means by the blue line. The dashed yellow line is a linear fit to the residuals. The RMS difference, linear correlation coefficient, and the trend of the residuals are listed in panel b. The dotted black line marks residuals of 0 Wm−2. The right panel shows the histogram of the residuals in bins of 0.05 Wm−2.
Current usage metrics show cumulative count of Article Views (full-text article views including HTML views, PDF and ePub downloads, according to the available data) and Abstracts Views on Vision4Press platform.
Data correspond to usage on the plateform after 2015. The current usage metrics is available 48-96 hours after online publication and is updated daily on week days.
Initial download of the metrics may take a while.