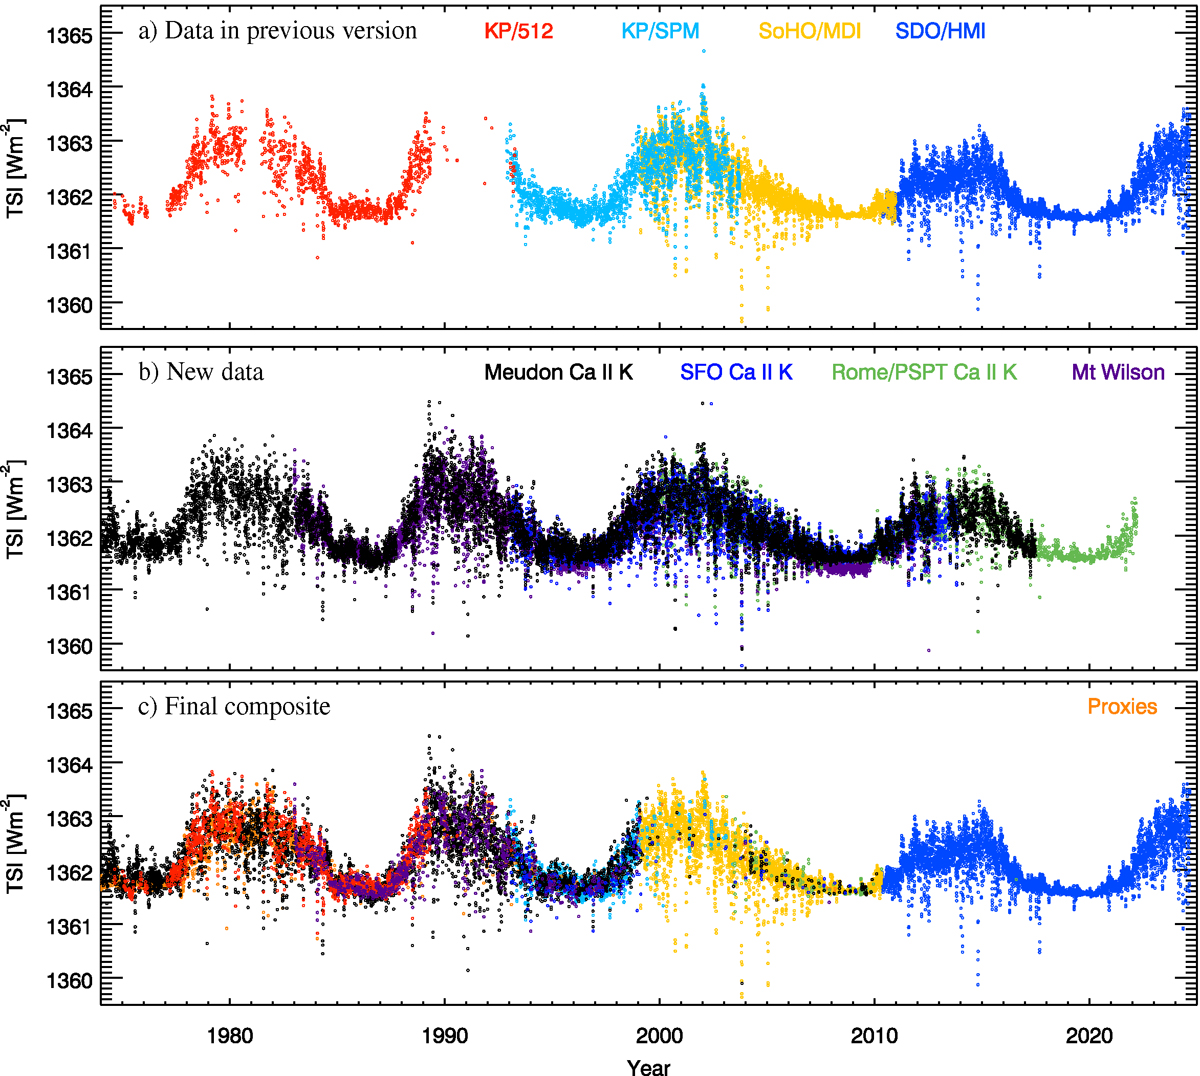
Fig. 6.
Download original image
SATIRE-S TSI reconstruction using different sources of magnetograms (shown in different colours according to the legends). Shown are daily values. The data that were included in the Yeo et al. (2014) version of the SATIRE-S TSI composite are shown in panel a, while the new data considered in this work are shown in panel b. Panel c shows the final new SATIRE-S TSI composite.
Current usage metrics show cumulative count of Article Views (full-text article views including HTML views, PDF and ePub downloads, according to the available data) and Abstracts Views on Vision4Press platform.
Data correspond to usage on the plateform after 2015. The current usage metrics is available 48-96 hours after online publication and is updated daily on week days.
Initial download of the metrics may take a while.