Fig. 5.
Download original image
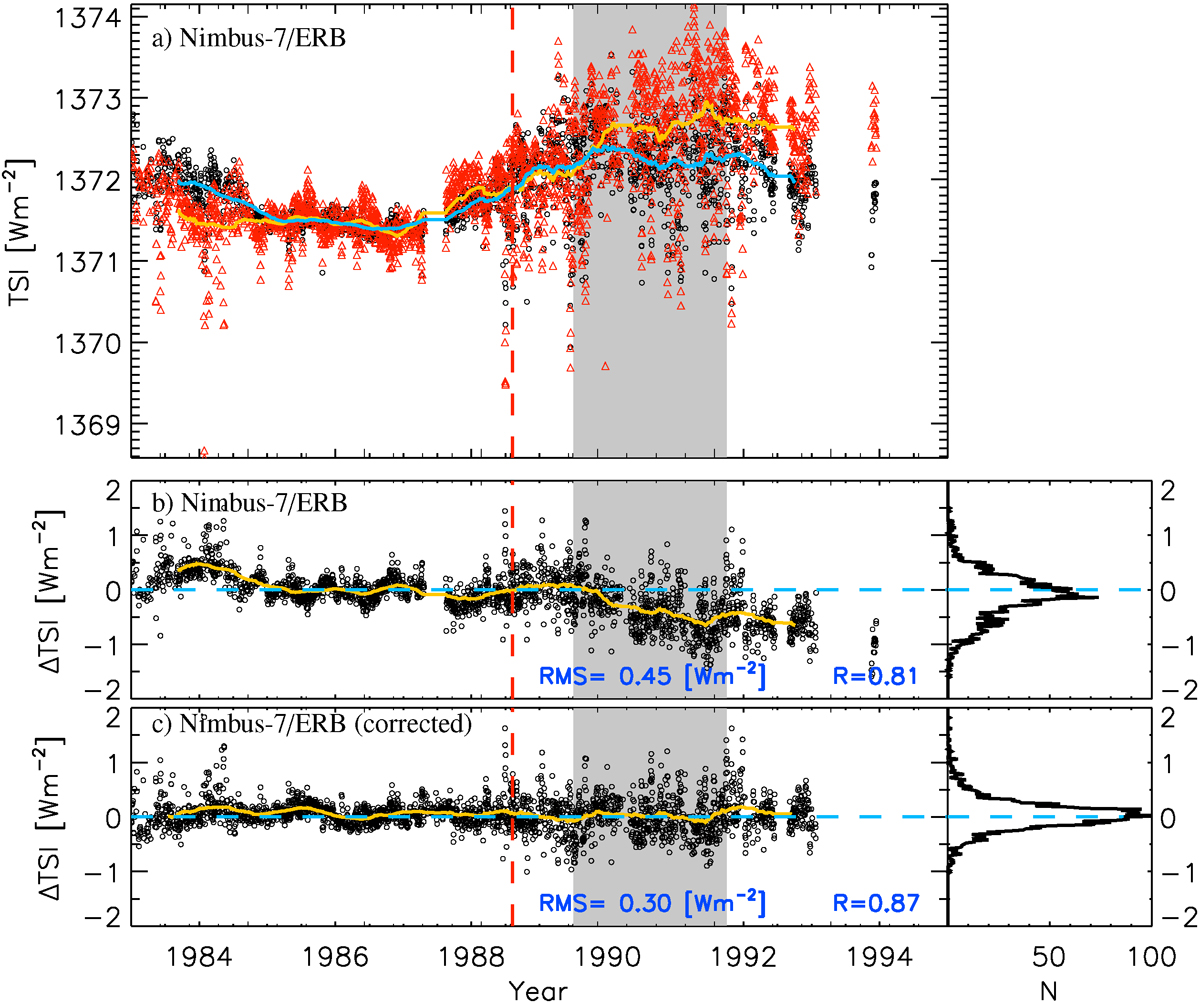
Panel a: TSI reconstruction with the SATIRE-S model using Mt Wilson magnetograms (black circles for daily and ciel line for 180-day running means) along with the Nimbus-7/ERB direct TSI measurements (red triangles for daily and yellow line for 180-day running means). Panels b–c: Comparison between TSI reconstruction with the SATIRE-S model using Mt Wilson magnetograms and direct TSI measurements over the ACRIM-gap (see legends in each panel). Shown are residuals (SATIRE-S with Mt Wilson minus the respective series in each panel) in daily values (black circles) and 180-day running means (yellow lines). The horizontal dashed ciel line marks residuals of 0 Wm−2. The vertical dashed red line marks the change in Mt Wilson instrumentation over August 1988. The grey shaded surface marks the ACRIM-gap period between July 1989 and October 1991. The right panels show the histogram of the residuals in bins of 0.02 Wm−2.
Current usage metrics show cumulative count of Article Views (full-text article views including HTML views, PDF and ePub downloads, according to the available data) and Abstracts Views on Vision4Press platform.
Data correspond to usage on the plateform after 2015. The current usage metrics is available 48-96 hours after online publication and is updated daily on week days.
Initial download of the metrics may take a while.