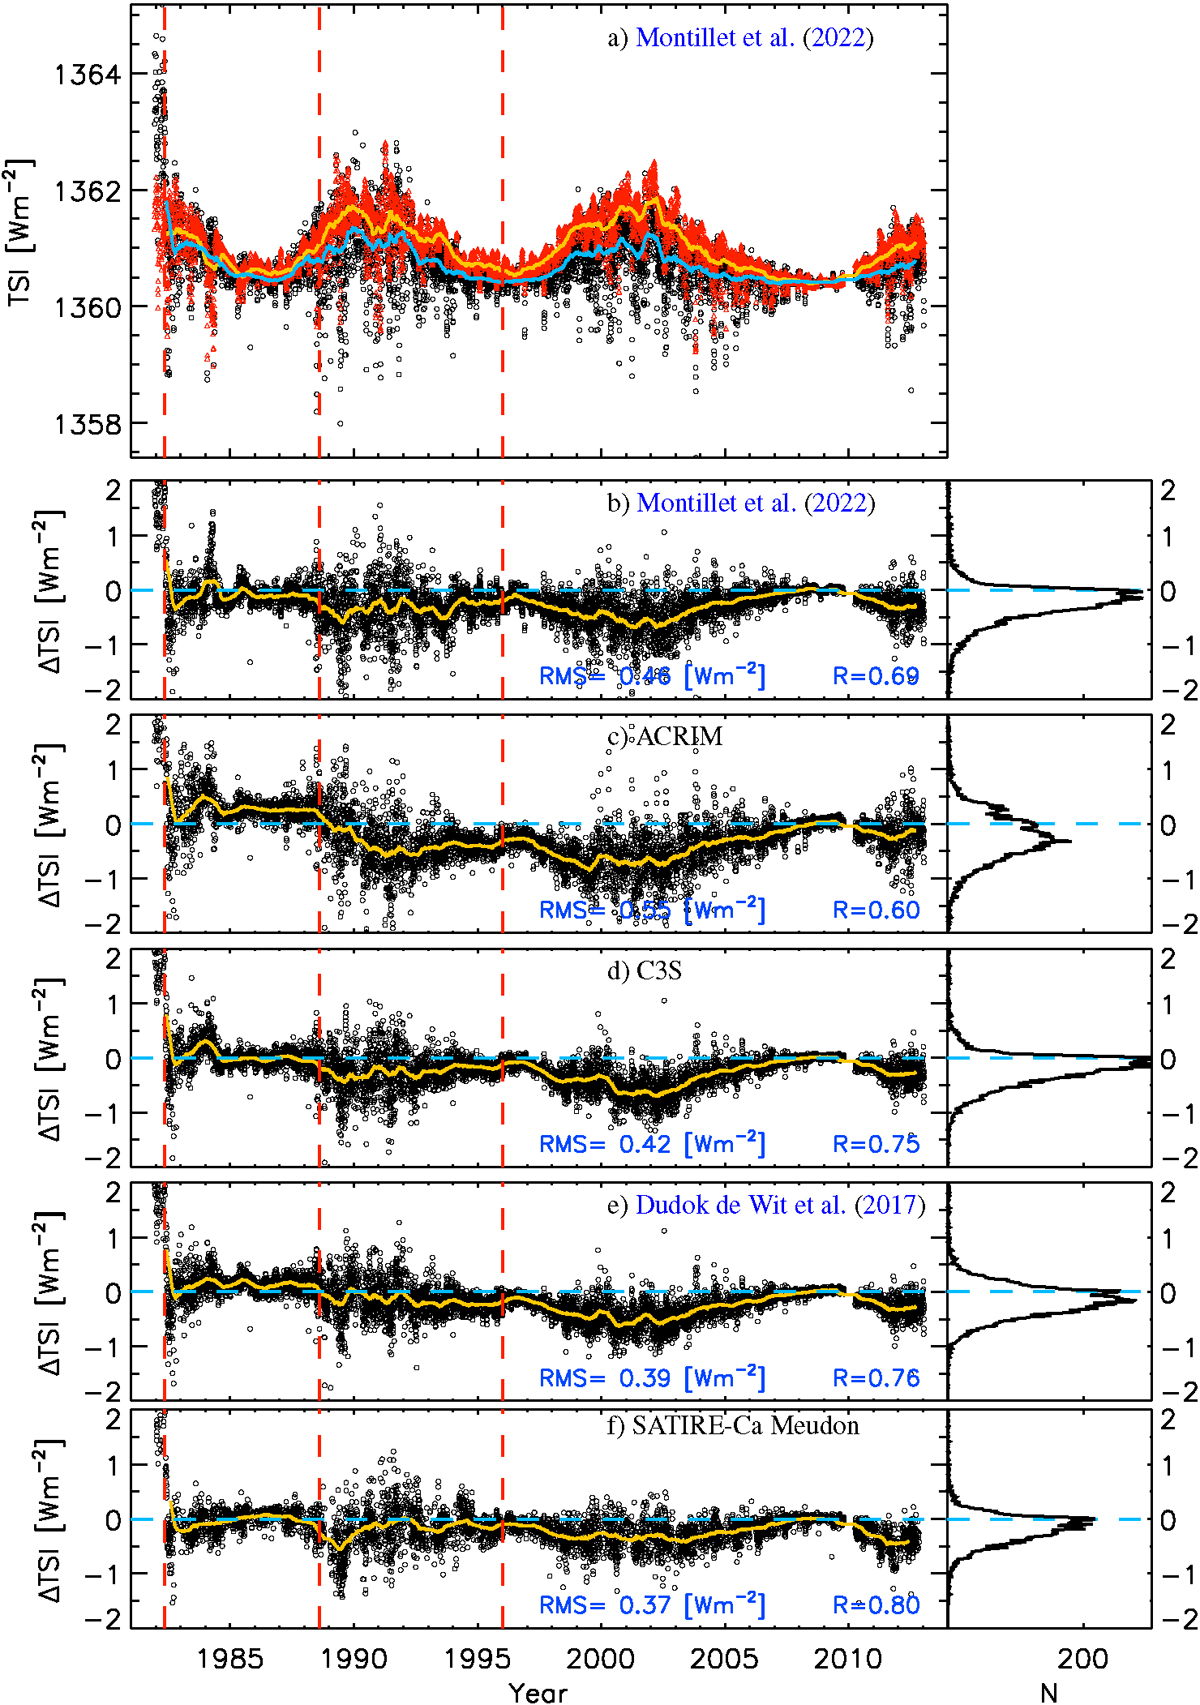
Fig. 3.
Download original image
Panel a: TSI reconstruction with the SATIRE-S model using Mt Wilson magnetograms (black circles for daily and ciel line for 180-day running means) along with the Montillet et al. (2022) TSI composite (red triangles for daily and yellow line for 180-day running means). Panels b–f: Difference between TSI reconstructed with the SATIRE-S model using Mt Wilson magnetograms and various TSI series as denoted by the legends. Daily values are shown as black circles and 180-day running means by yellow curve. All series have been offset to match the value of Montillet et al. (2022) TSI composite over 2008. The horizontal dashed ciel line marks residuals of 0 Wm−2. The vertical dashed red lines mark periods of relevant instrumental changes in the Mt Wilson data. The right panel shows the histogram of the residuals in bins of 0.02 Wm−2.
Current usage metrics show cumulative count of Article Views (full-text article views including HTML views, PDF and ePub downloads, according to the available data) and Abstracts Views on Vision4Press platform.
Data correspond to usage on the plateform after 2015. The current usage metrics is available 48-96 hours after online publication and is updated daily on week days.
Initial download of the metrics may take a while.