Fig. 2.
Download original image
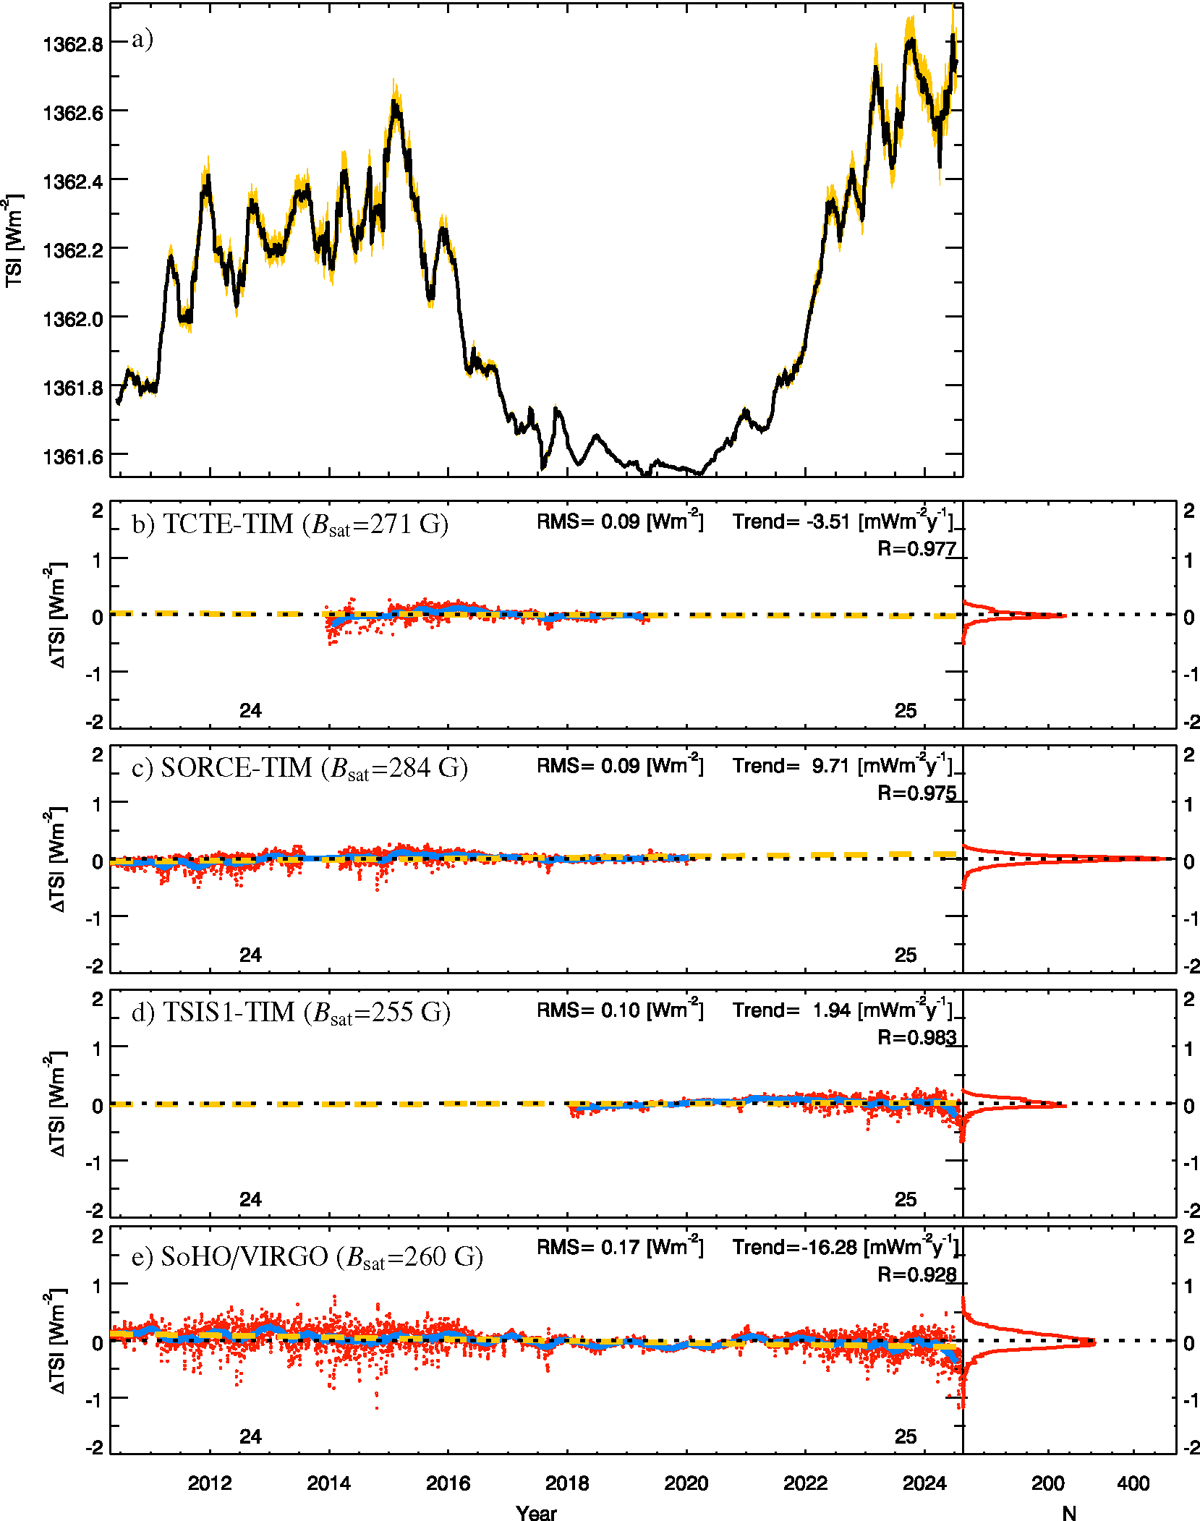
Panel a: TSI reconstructions with SATIRE-S using SDO/HMI magnetograms. Our adopted reconstruction is shown as 81-day running means in black, while the shaded yellow surface denotes the uncertainty due to the choice of the reference TSI dataset used to set Bsat. Panels b–e: Difference between the TSI reconstructed with the SATIRE-S model using SDO/HMI magnetograms and various TSI series as denoted by the legends. Daily values are represented by red circles, 180-day running means by the ciel curves. All series have been offset to match the value of SORCE/TIM over 2019. The horizontal dotted black line marks residuals of 0 Wm−2. The dashed yellow lines are linear fits to the residuals. Also given within each panel are the RMS differences, linear correlation coefficient, R, and the trend of the residuals. The right panel shows the histogram of the residuals in bins of 0.02 Wm−2.
Current usage metrics show cumulative count of Article Views (full-text article views including HTML views, PDF and ePub downloads, according to the available data) and Abstracts Views on Vision4Press platform.
Data correspond to usage on the plateform after 2015. The current usage metrics is available 48-96 hours after online publication and is updated daily on week days.
Initial download of the metrics may take a while.