Fig. 10.
Download original image
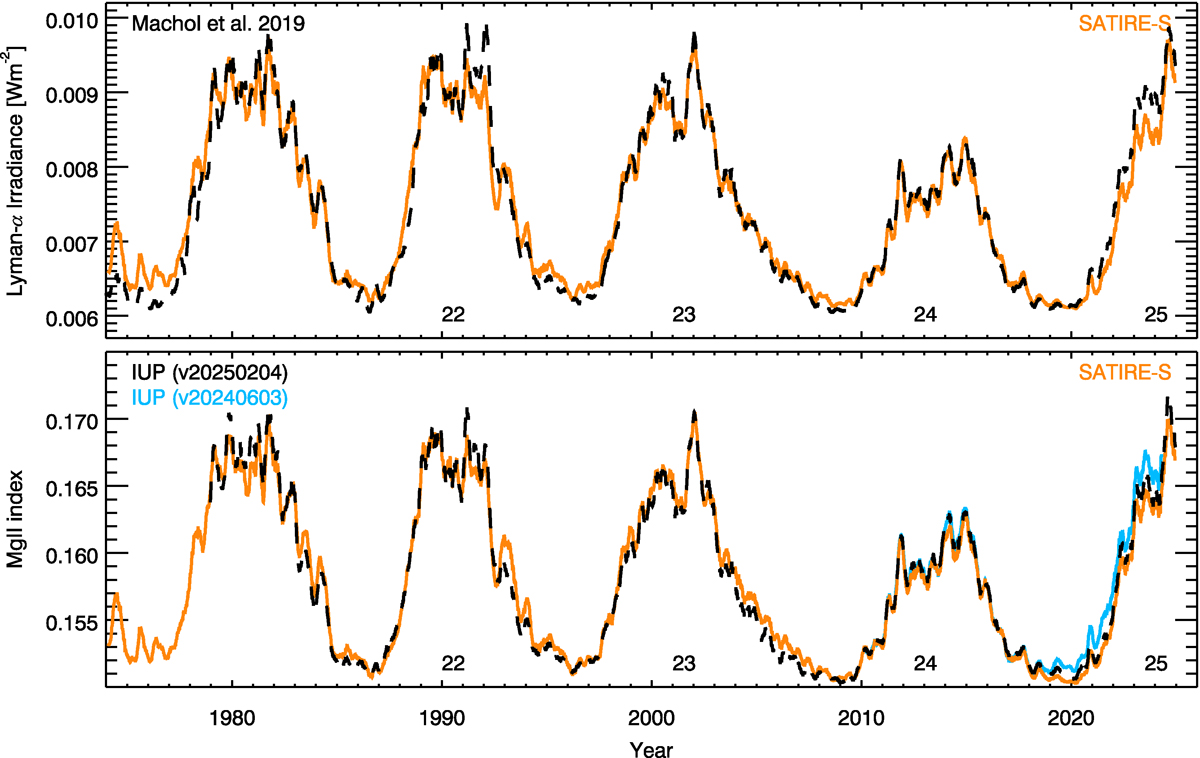
Top: Comparison between the reconstructed Lyman-α irradiance from SATIRE-S (orange) and the Machol et al. (2019) composite (black). Shown are 81-day running means. The series are shown without any adjustment. Bottom: Comparison between the reconstructed Mg II irradiance from SATIRE-S (orange) and the IUP Mg II core-to-wing composite (Viereck et al. 2001, black for version 20250204 and ciel for version 20240603). Our Mg II irradiance has been linearly scaled to match the IUP Mg II index (see Sect. 5). The numbers in the lower part of the figures denote the conventional solar cycle numbering.
Current usage metrics show cumulative count of Article Views (full-text article views including HTML views, PDF and ePub downloads, according to the available data) and Abstracts Views on Vision4Press platform.
Data correspond to usage on the plateform after 2015. The current usage metrics is available 48-96 hours after online publication and is updated daily on week days.
Initial download of the metrics may take a while.