Fig. 1.
Download original image
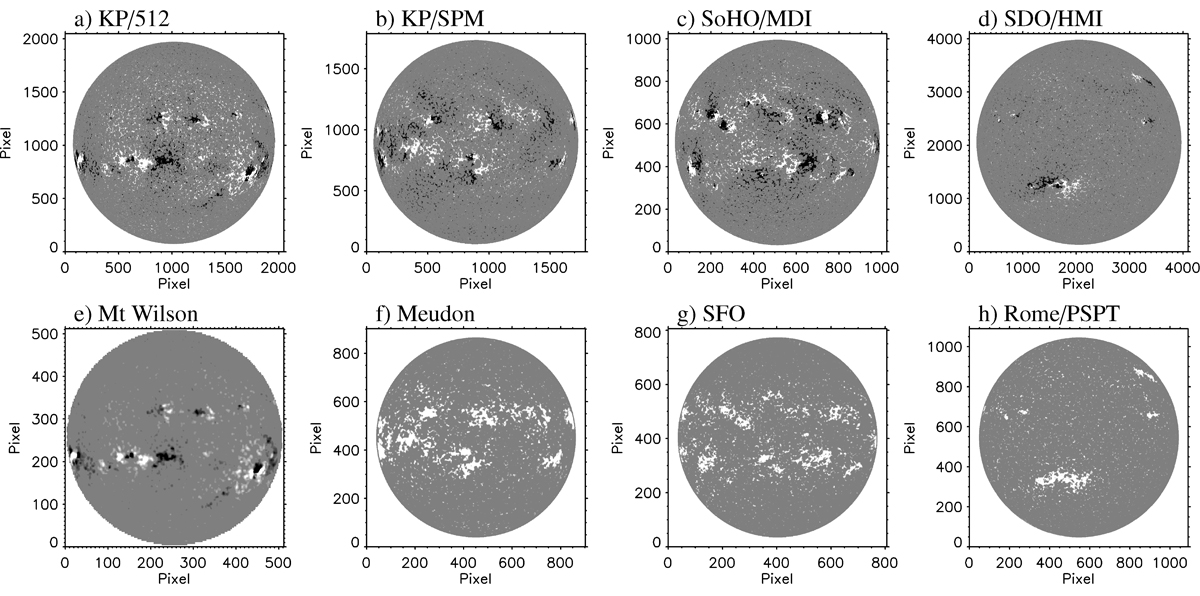
Examples of magnetograms from the various archives used in this study. The dates of the observations from left to right are 30 May 1983, 28 April 1993, 23 April 2002, and 10 November 2010. All magnetograms are saturated at ±50 G after removing the signal below the respective noise levels. The three images obtained from Ca II K observations correspond to unsigned magnetic field.
Current usage metrics show cumulative count of Article Views (full-text article views including HTML views, PDF and ePub downloads, according to the available data) and Abstracts Views on Vision4Press platform.
Data correspond to usage on the plateform after 2015. The current usage metrics is available 48-96 hours after online publication and is updated daily on week days.
Initial download of the metrics may take a while.