Fig. 3.
Download original image
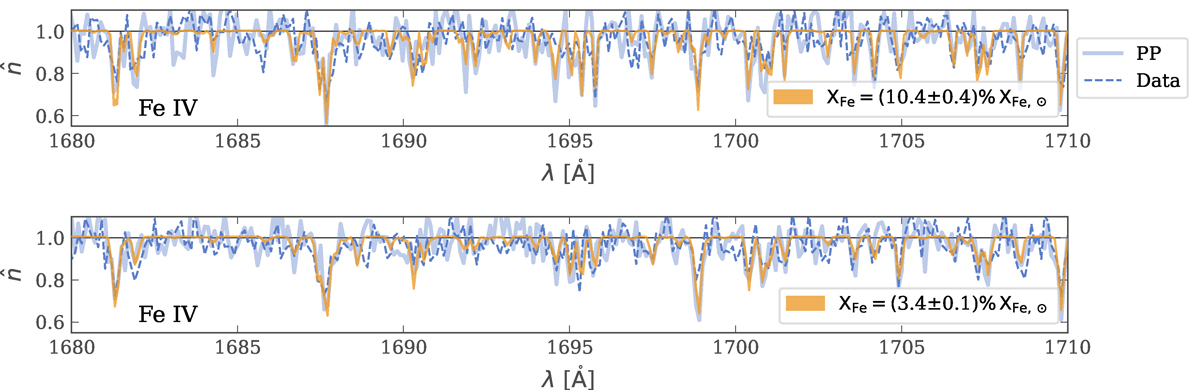
Comparison of the observed (dashed blue line) and best-fit modeled (orange) Fe IV forest of lines for fixed microturbulence values of ξ = 2 km s−1 for MBO2 (top) and ξ = 10 km s−1 for MBO3 (bottom). The thickness of the orange model line represents the 3σ credible interval of the best-fit model. A PP sample is shown in light blue. The full spectral fits are given in Appendix E.
Current usage metrics show cumulative count of Article Views (full-text article views including HTML views, PDF and ePub downloads, according to the available data) and Abstracts Views on Vision4Press platform.
Data correspond to usage on the plateform after 2015. The current usage metrics is available 48-96 hours after online publication and is updated daily on week days.
Initial download of the metrics may take a while.