Open Access
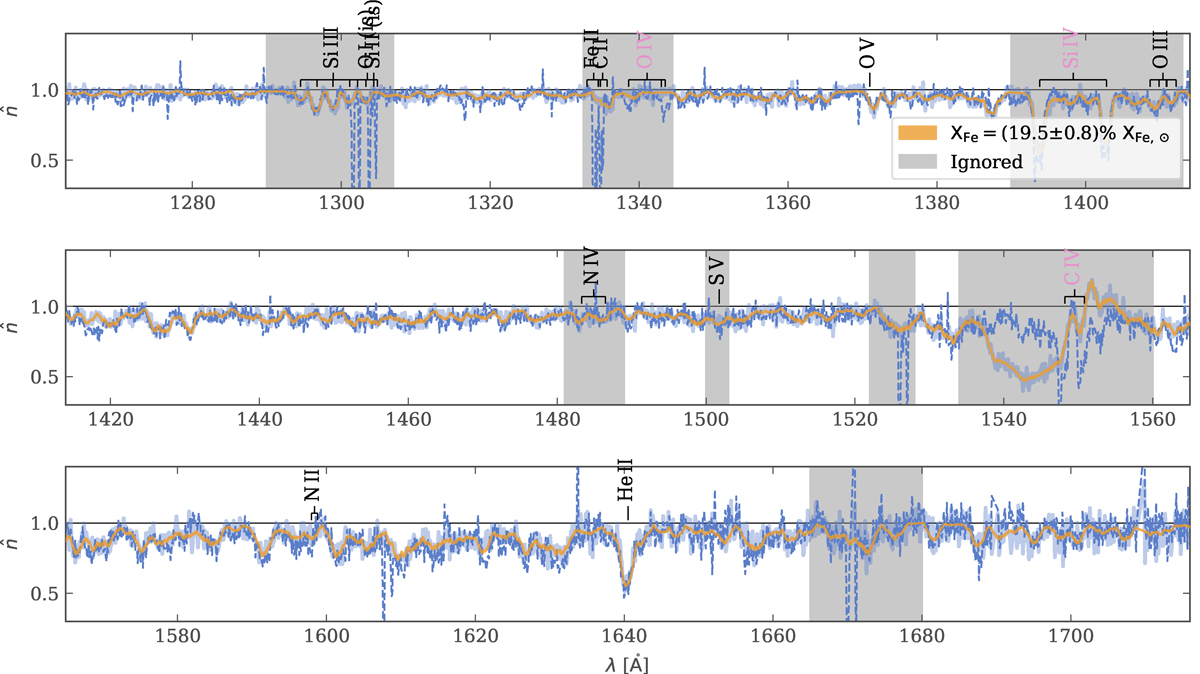
Fig. E.12.
Download original image
Comparison of the observed (dashed, blue line) and best-fit modelled spectrum (orange) for DI1388 and a fixed microturbulence of ξ = 5 km s−1. The thick light blue line depicts a PP sample. Regions which are ignored in the fit are highlighted in grey.
Current usage metrics show cumulative count of Article Views (full-text article views including HTML views, PDF and ePub downloads, according to the available data) and Abstracts Views on Vision4Press platform.
Data correspond to usage on the plateform after 2015. The current usage metrics is available 48-96 hours after online publication and is updated daily on week days.
Initial download of the metrics may take a while.