Fig. 3
Download original image
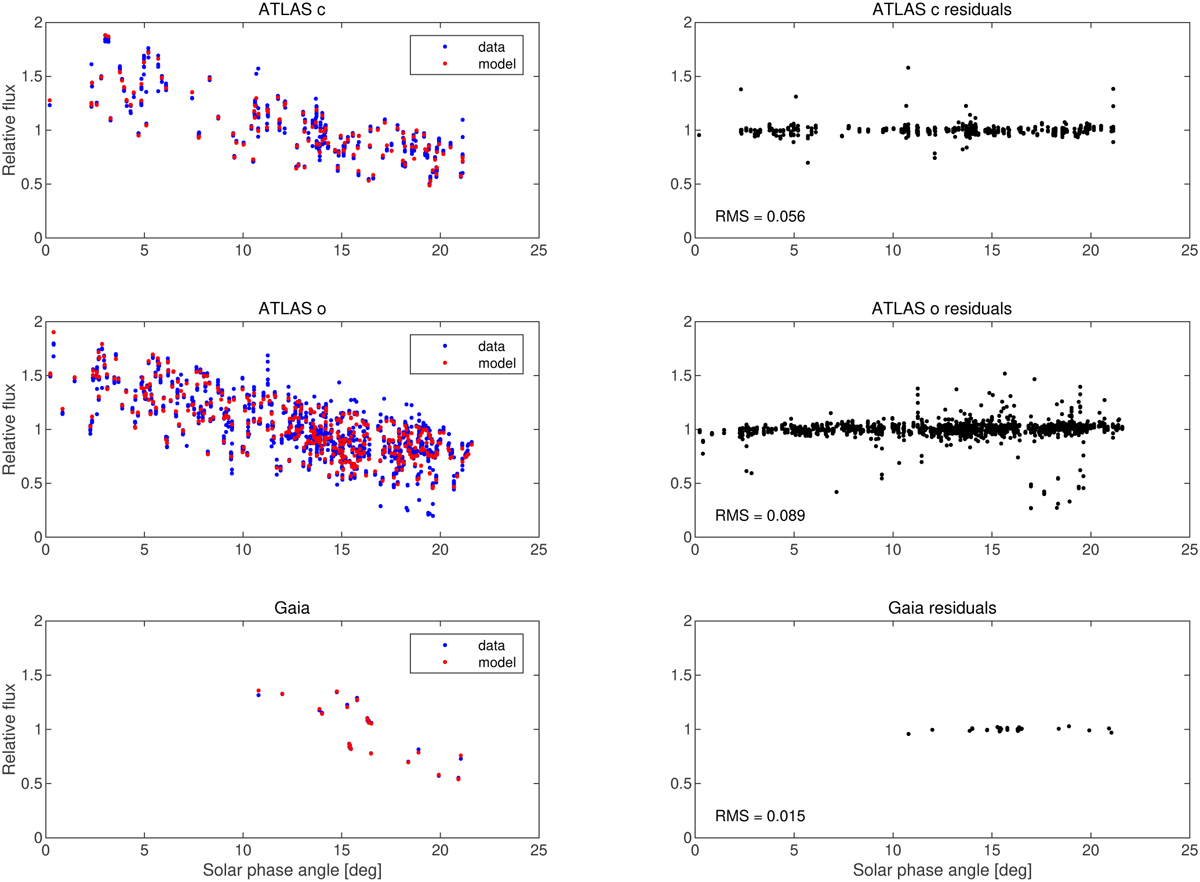
Sparse photometry from surveys. The left panels show the comparison between the light curve predicted by the convex shape model (red points) and observed photometric data (blue points) from ATLAS in c and o filters and Gaia. The brightness in relative flux units is plotted against the solar phase angle to see the phase curve. The three panels on the right show the difference between observed and modeled brightness and the values of root mean square residuals.
Current usage metrics show cumulative count of Article Views (full-text article views including HTML views, PDF and ePub downloads, according to the available data) and Abstracts Views on Vision4Press platform.
Data correspond to usage on the plateform after 2015. The current usage metrics is available 48-96 hours after online publication and is updated daily on week days.
Initial download of the metrics may take a while.