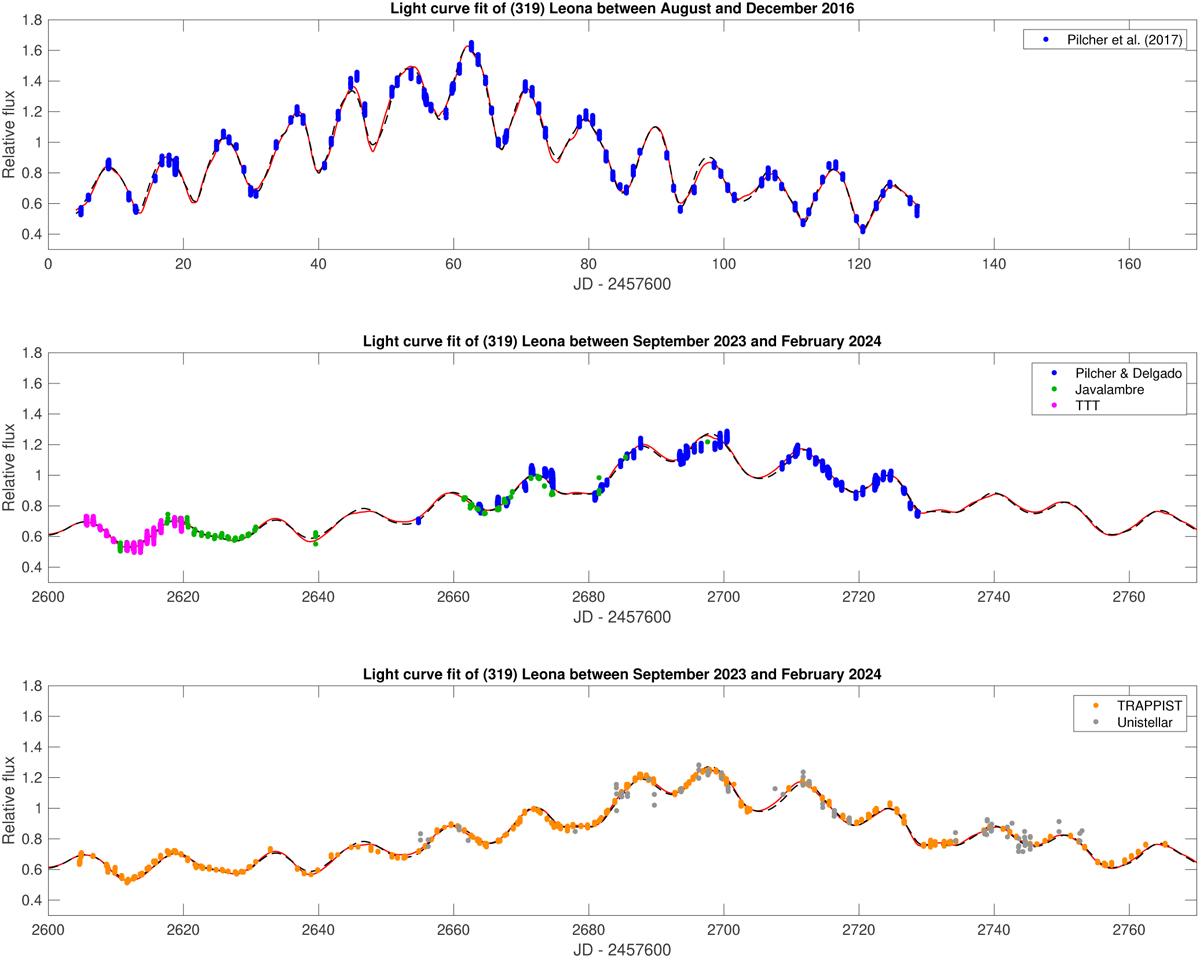
Fig. 2
Download original image
Comparison between model light curves and observations. The light curves predicted by the convex shape model (solid red curve) and the nonconvex shape model (dashed black curve) are plotted against the observed photometric data (points). The top panel shows data by Pilcher et al. (2017) from 2016; the middle and bottom panels show five sets of new observations from 2023/24.
Current usage metrics show cumulative count of Article Views (full-text article views including HTML views, PDF and ePub downloads, according to the available data) and Abstracts Views on Vision4Press platform.
Data correspond to usage on the plateform after 2015. The current usage metrics is available 48-96 hours after online publication and is updated daily on week days.
Initial download of the metrics may take a while.