Fig. 4
Download original image
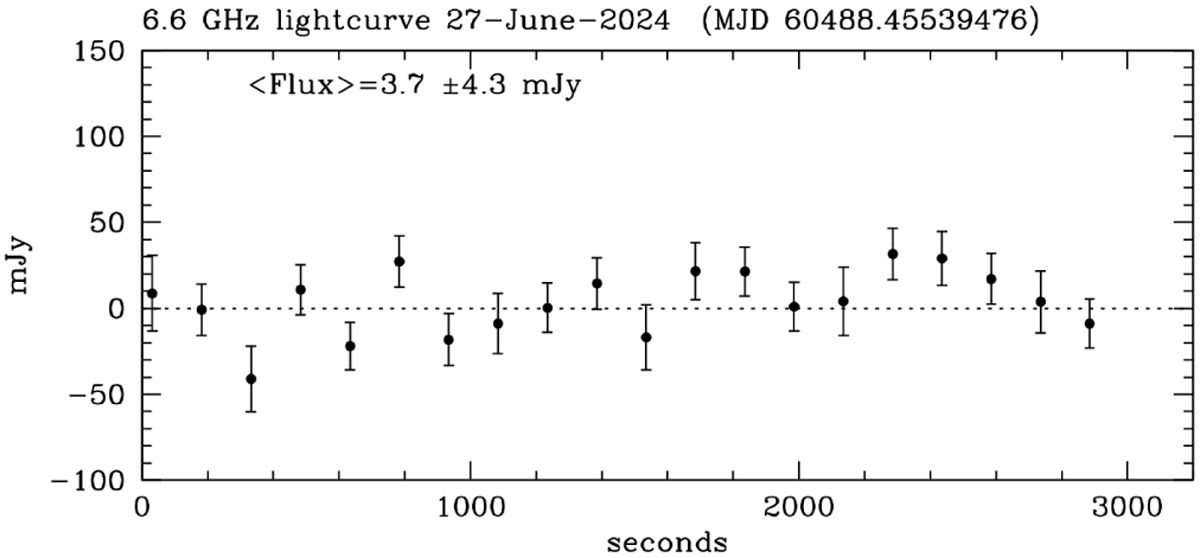
SRT 6.6 GHz total intensity light curve for 27 June 2024. The flux density reported in the plot (<Flux> = 3.7±4.3 mJy) represents the mean of N = 20 measurements, and the error bar has been determined as ![]() , from which a 3σ upper limit of <13 mJy is derived. We removed from the flux density light curve the contribution of the nearby confusion source NVSS J040522+200958, which is 0.15 mJy at 6.6 GHz based on our calculation.
, from which a 3σ upper limit of <13 mJy is derived. We removed from the flux density light curve the contribution of the nearby confusion source NVSS J040522+200958, which is 0.15 mJy at 6.6 GHz based on our calculation.
Current usage metrics show cumulative count of Article Views (full-text article views including HTML views, PDF and ePub downloads, according to the available data) and Abstracts Views on Vision4Press platform.
Data correspond to usage on the plateform after 2015. The current usage metrics is available 48-96 hours after online publication and is updated daily on week days.
Initial download of the metrics may take a while.