Fig. 3
Download original image
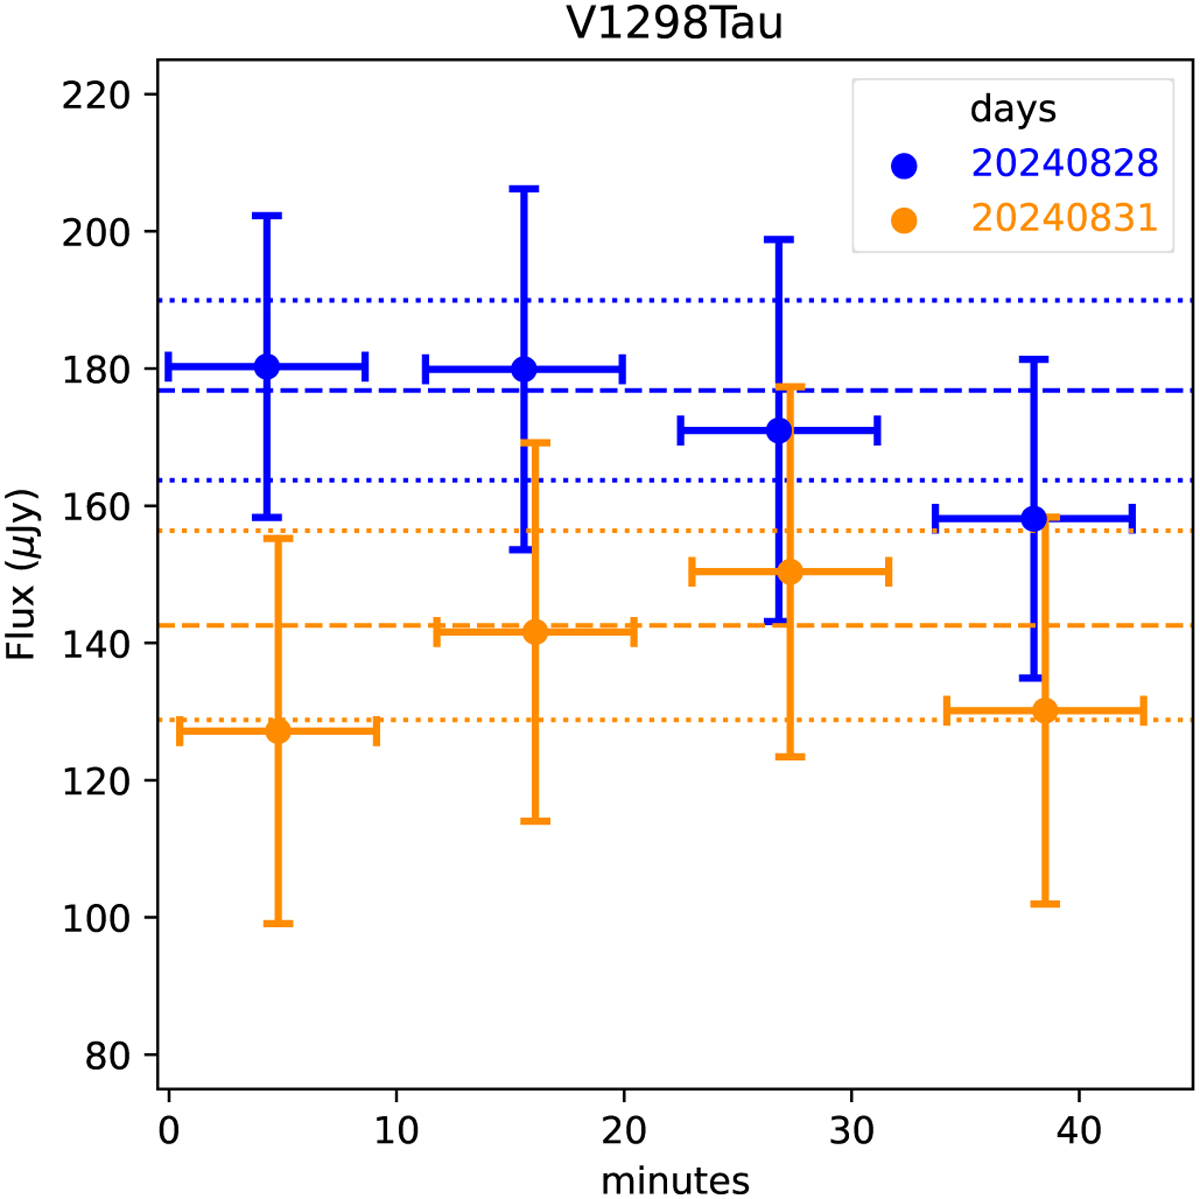
Variation of Stokes / fluxes during the two JVLA C-Band epochs with the brightest emission, (blue) for 28 August 2024 and (orange) for 31 August 2024, where t = 0 marks the beginning of the first on-source scan for each epoch, and the data of the second epoch have been shifted by 0.5 min on the x-axis for better visualisation. The horizontal bars indicate the intervals of source scans. The horizontal lines correspond to the average and Iσ confidence level.
Current usage metrics show cumulative count of Article Views (full-text article views including HTML views, PDF and ePub downloads, according to the available data) and Abstracts Views on Vision4Press platform.
Data correspond to usage on the plateform after 2015. The current usage metrics is available 48-96 hours after online publication and is updated daily on week days.
Initial download of the metrics may take a while.