Fig. 2
Download original image
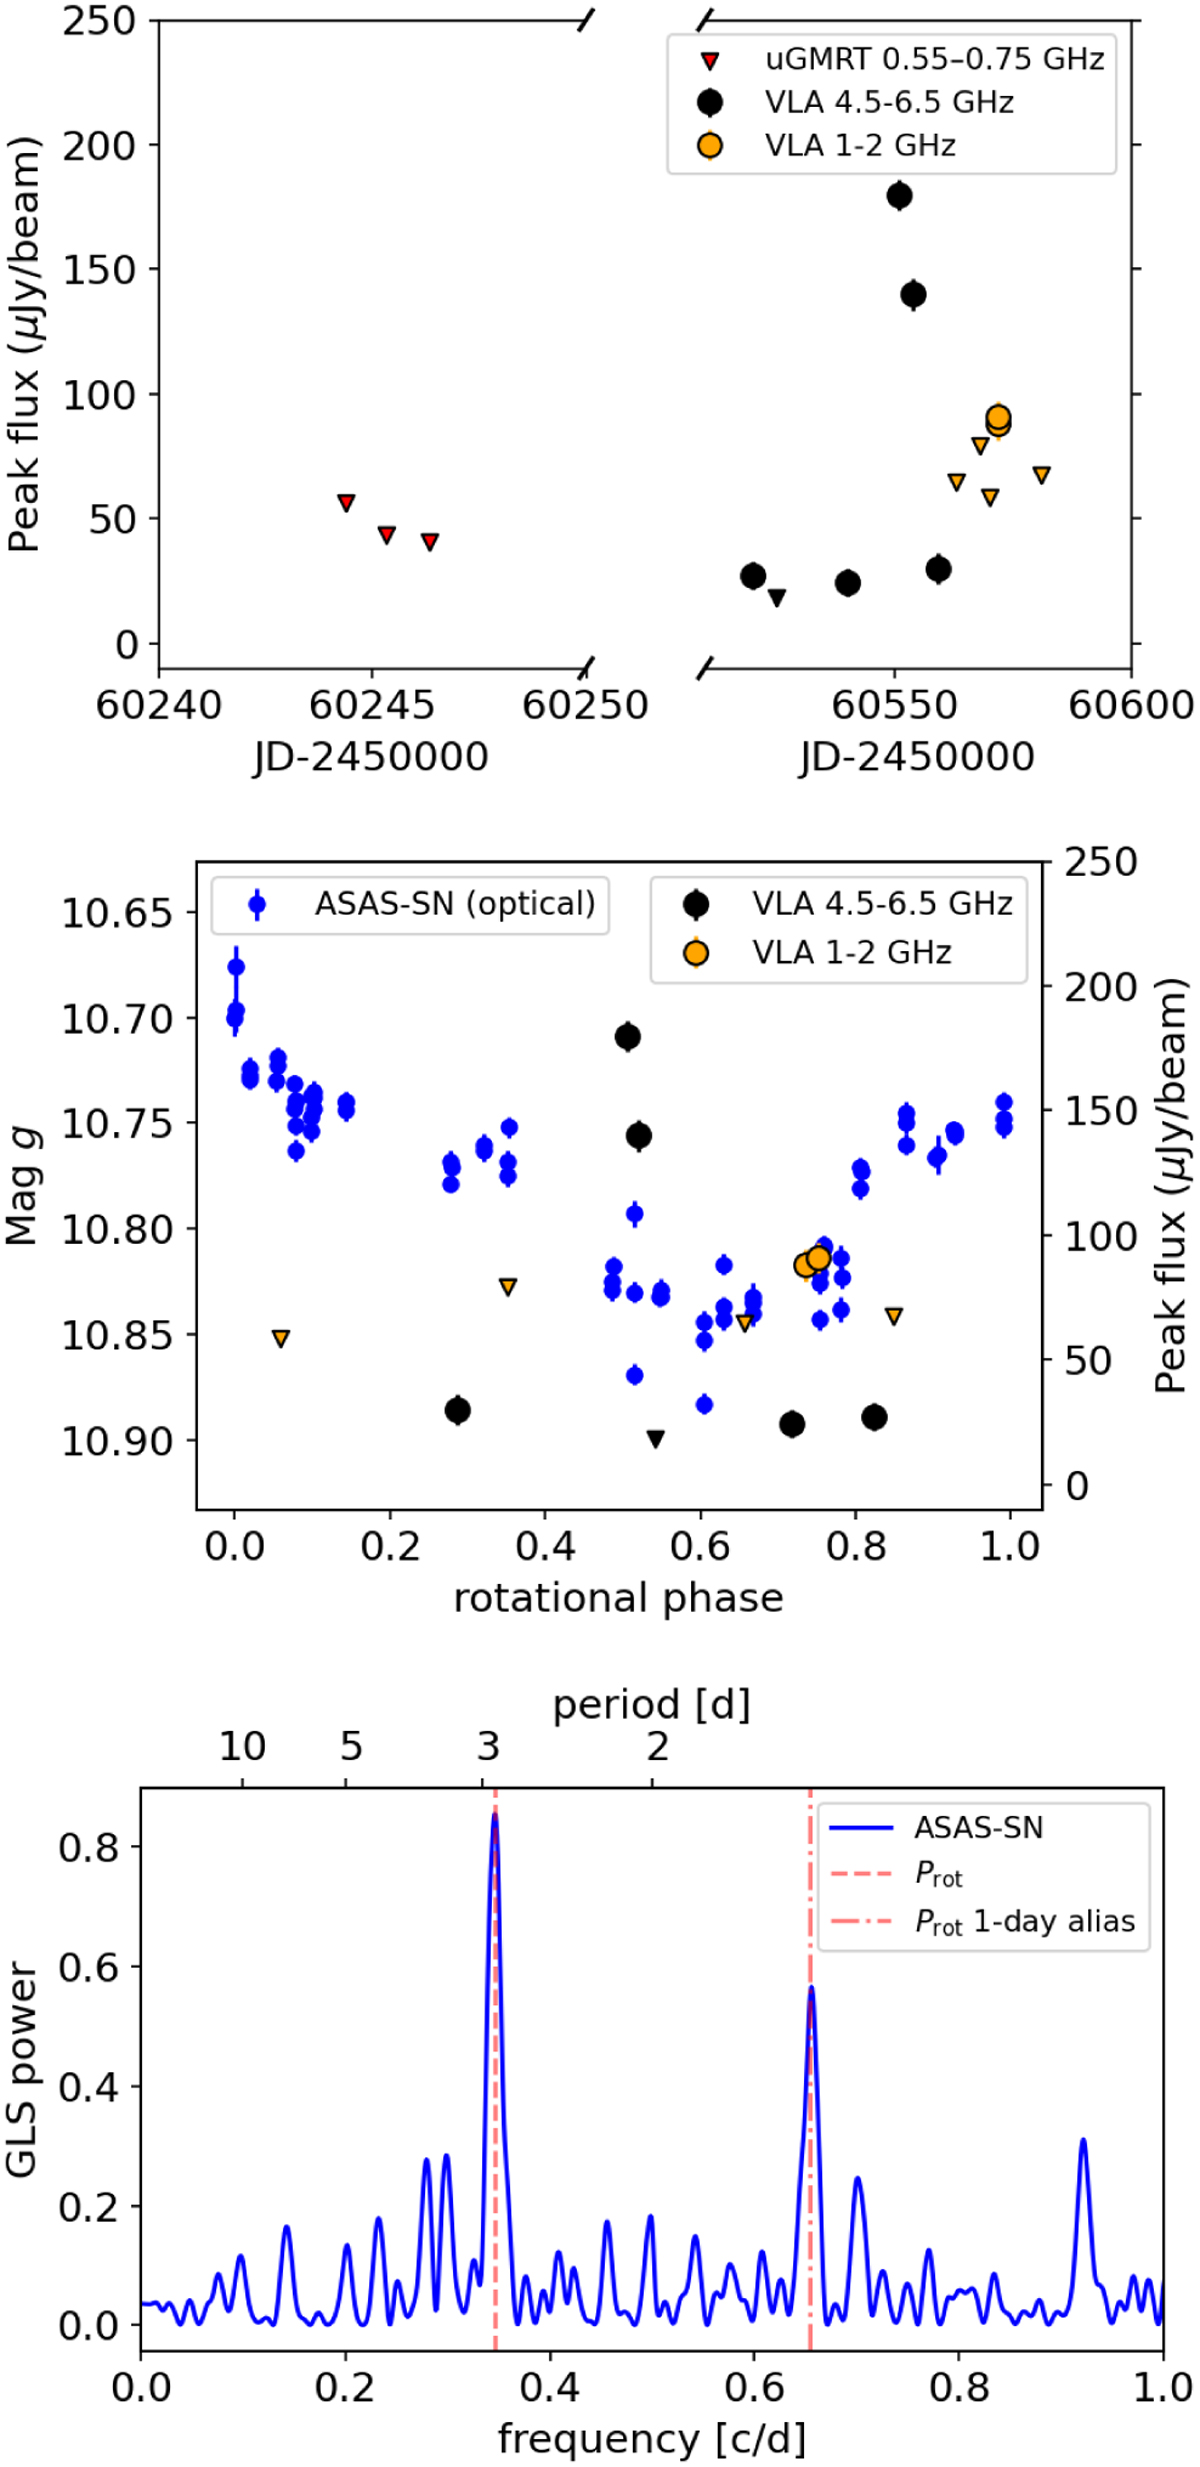
Upper panel: peak flux values (dots) and 3σ upper limits (triangles) of the JVLA observations in L- and C-bands (black and orange data points), and GMRT in band 4 (red data points), as a function of the observing epoch. Middle panel: ASAS-SN ɡ-band magnitudes and JVLA radio fluxes phase-folded to the stellar rotation period P~2.9 days. Phase zero corresponds to the first epoch of the JVLA C-band observations. Optical and radio observations were carried out within the same time span. Lower panel: GLS periodogram of the ASAS-SN optical light curve collected over the time span covered by JVLA observations (28 July–28 Sept. 2024). The stellar rotation period of ~2.9 days is indicated by a red dashed line.
Current usage metrics show cumulative count of Article Views (full-text article views including HTML views, PDF and ePub downloads, according to the available data) and Abstracts Views on Vision4Press platform.
Data correspond to usage on the plateform after 2015. The current usage metrics is available 48-96 hours after online publication and is updated daily on week days.
Initial download of the metrics may take a while.