Open Access
Fig. 9
Download original image
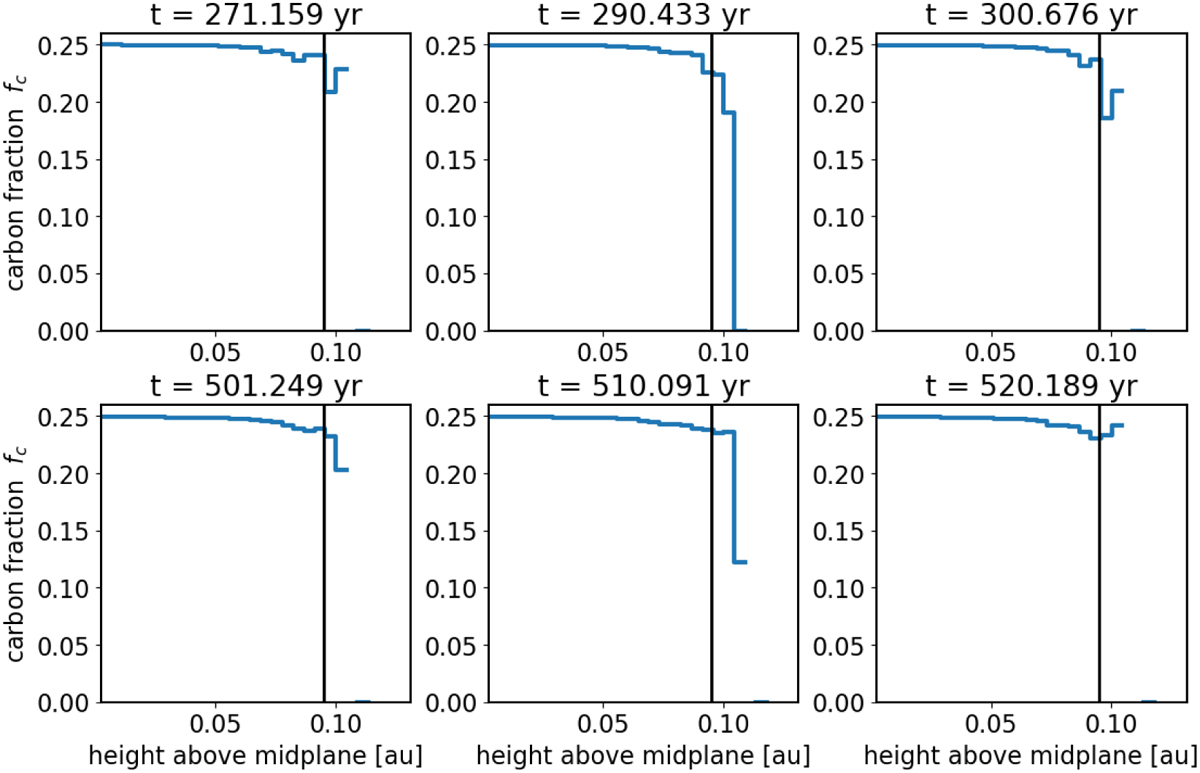
Time evolution snapshots of the carbon fraction, fc, for the height bins z for the run fiducialfc025. Moving from left to right we can see the carbon is depleted and replenished quickly. The vertical black line represents the τUV = 1 line and the start of the exposed layer.
Current usage metrics show cumulative count of Article Views (full-text article views including HTML views, PDF and ePub downloads, according to the available data) and Abstracts Views on Vision4Press platform.
Data correspond to usage on the plateform after 2015. The current usage metrics is available 48-96 hours after online publication and is updated daily on week days.
Initial download of the metrics may take a while.