Open Access
Fig. 7
Download original image
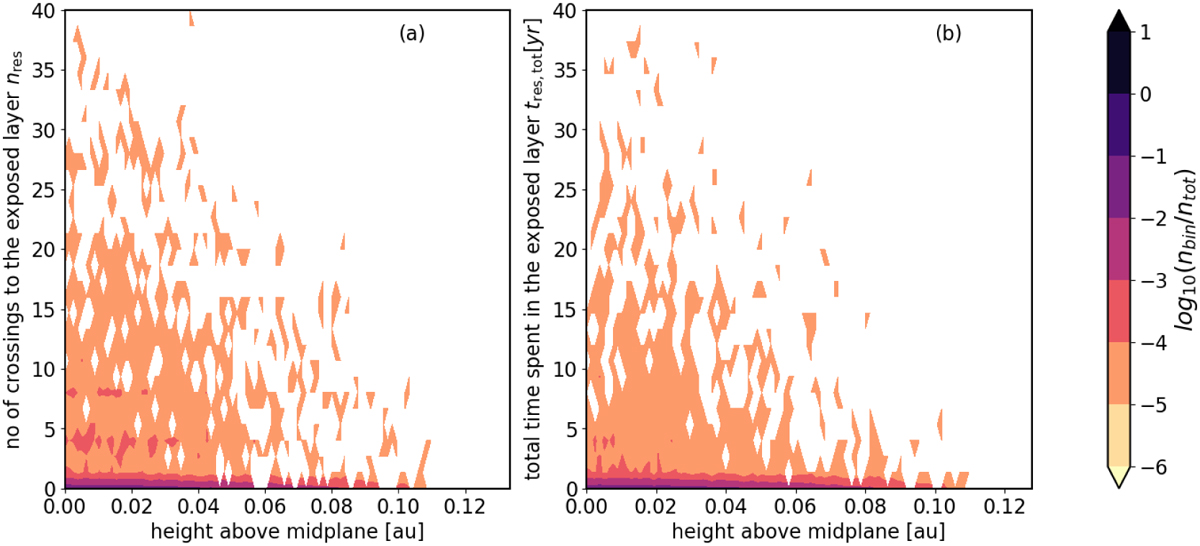
Panel a: number of particles (normalized with the total number of particles) at every height z and their cumulative number of crossings to the exposed layer nres at the end of the run fiducialfc025. Panel b: similar plot, but with total residence times of the particles tres,tot at every height z.
Current usage metrics show cumulative count of Article Views (full-text article views including HTML views, PDF and ePub downloads, according to the available data) and Abstracts Views on Vision4Press platform.
Data correspond to usage on the plateform after 2015. The current usage metrics is available 48-96 hours after online publication and is updated daily on week days.
Initial download of the metrics may take a while.