Open Access
Fig. 2
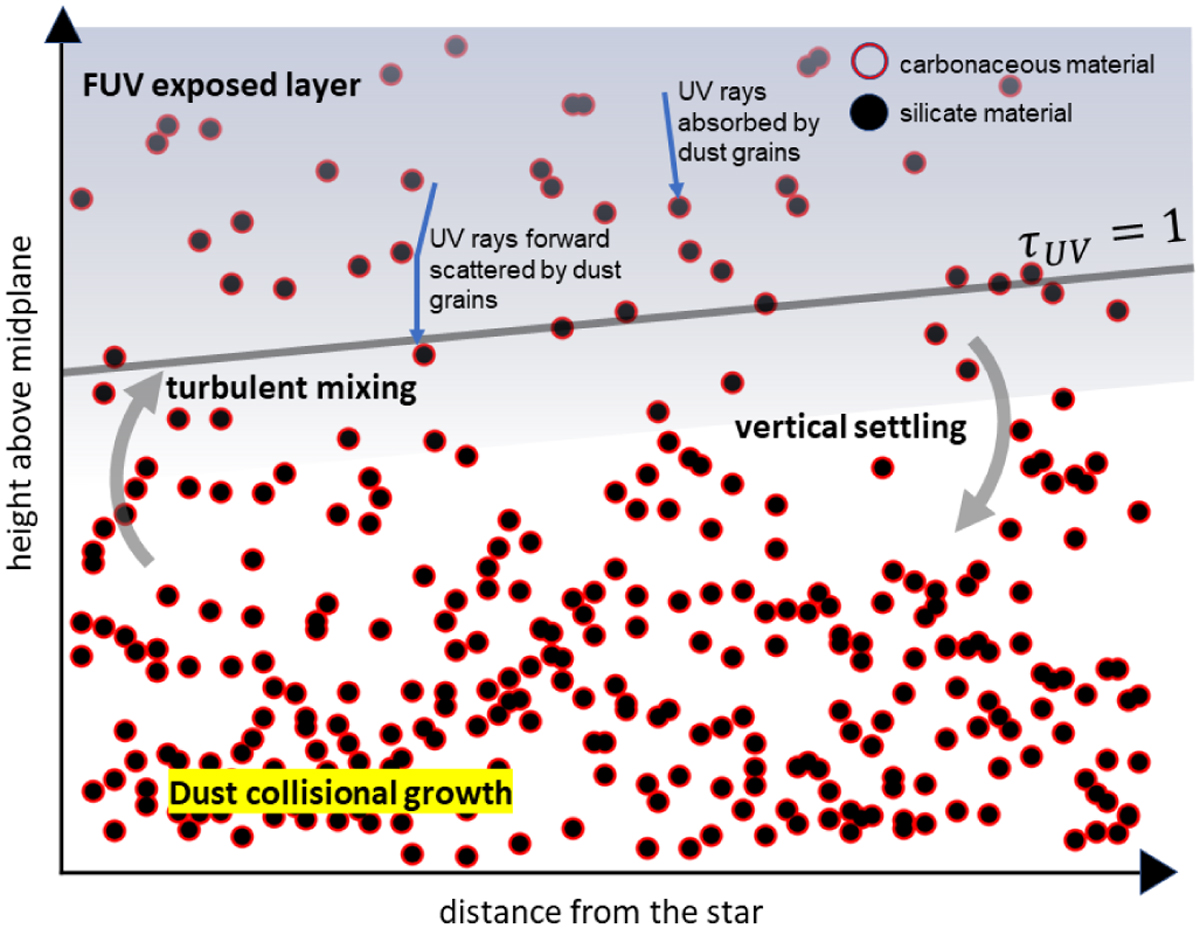
Download original image
Vertical slice of the model in use. At lower z the larger dust aggregates settle down to the midplane. The dust particles move around due to the mixing processes. The blue gradient represents the FUV flux that gets absorbed and scattered as we come down to the midplane.
Current usage metrics show cumulative count of Article Views (full-text article views including HTML views, PDF and ePub downloads, according to the available data) and Abstracts Views on Vision4Press platform.
Data correspond to usage on the plateform after 2015. The current usage metrics is available 48-96 hours after online publication and is updated daily on week days.
Initial download of the metrics may take a while.