Fig. 9
Download original image
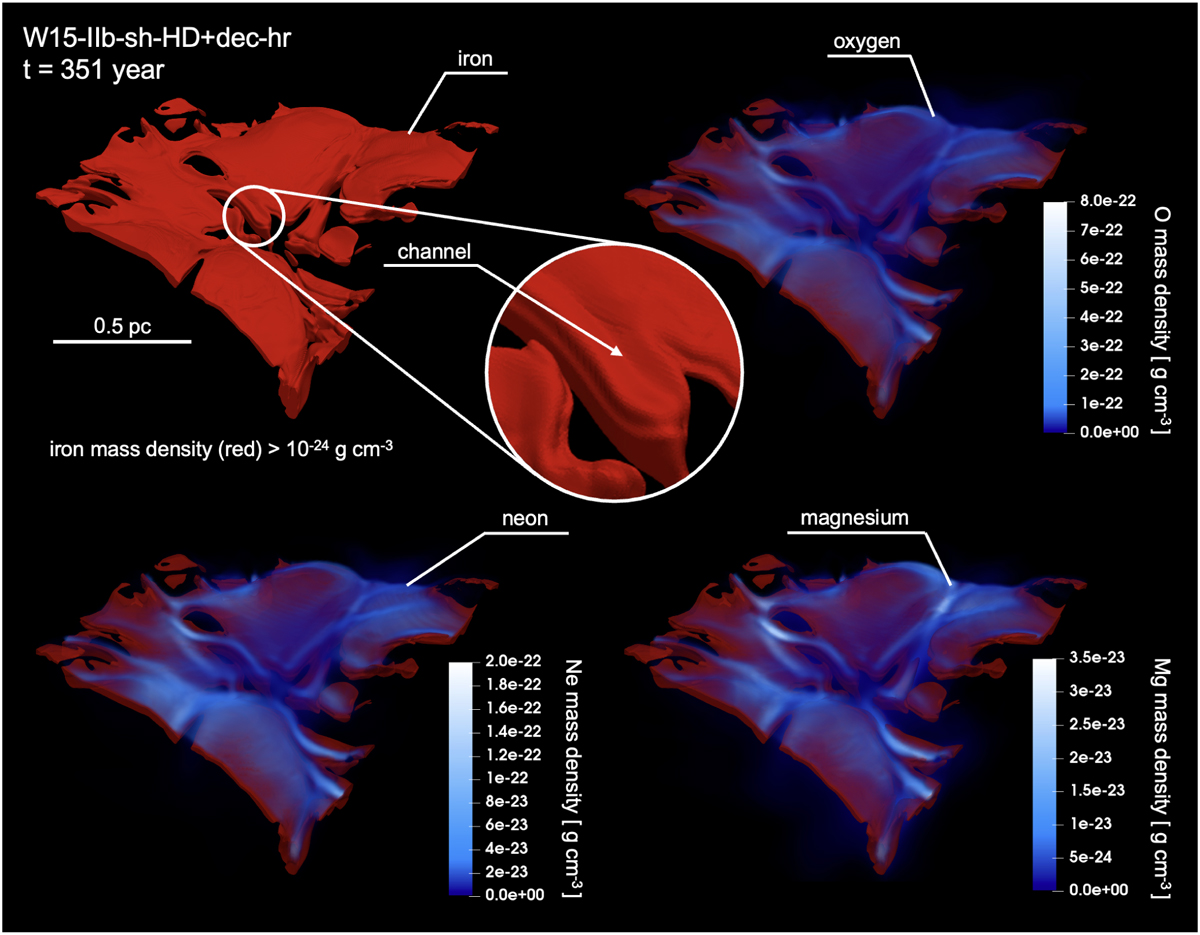
Close-up view of the region containing the central bundle of filaments highlighted in Fig. 8. The unshocked Fe-rich ejecta with densities greater than 10−24 g cm−3 are represented as a red isosurface. The corresponding distributions of ejecta enriched in O (top right), Ne (bottom left), and Mg (bottom right) are visualized through volume rendering using a blue color palette. Each panel includes a color scale on the right, indicating the density variations of the respective elements.
Current usage metrics show cumulative count of Article Views (full-text article views including HTML views, PDF and ePub downloads, according to the available data) and Abstracts Views on Vision4Press platform.
Data correspond to usage on the plateform after 2015. The current usage metrics is available 48-96 hours after online publication and is updated daily on week days.
Initial download of the metrics may take a while.