Fig. 5
Download original image
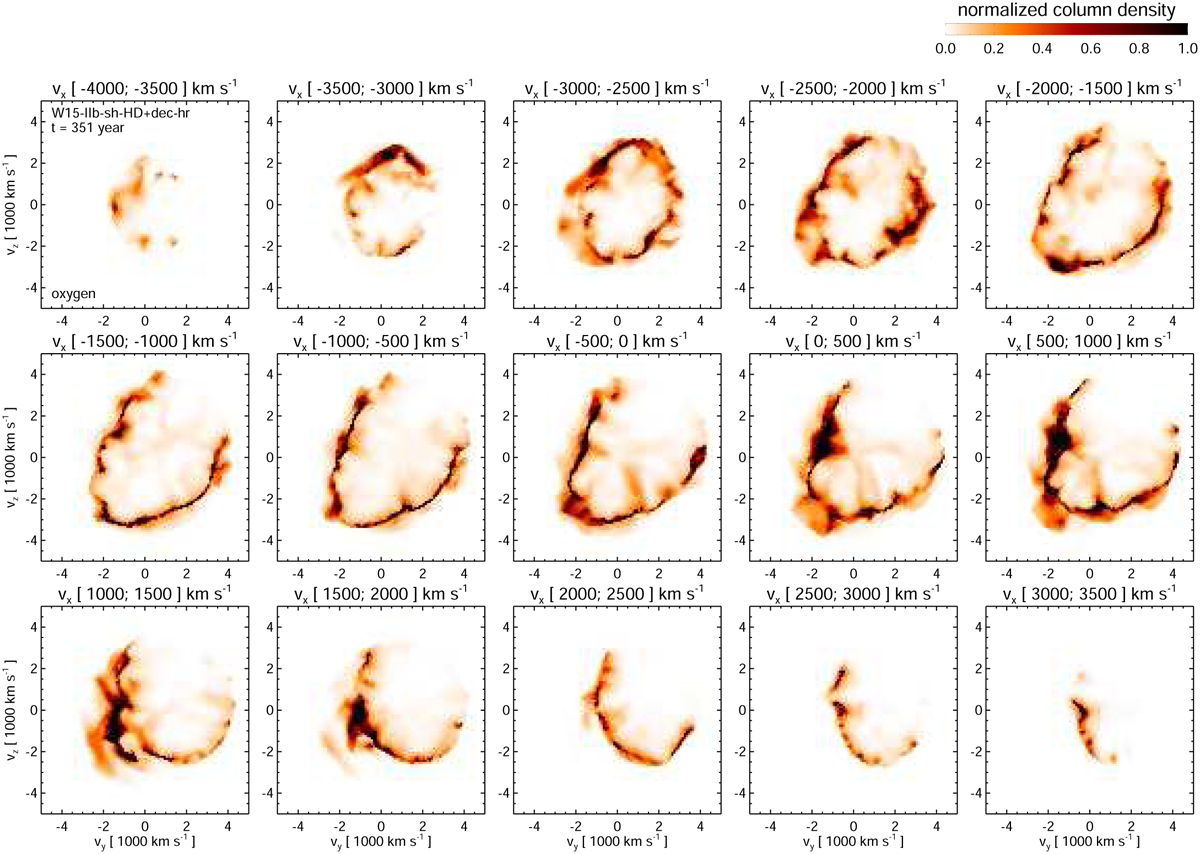
Distribution of O-rich ejecta as a function of velocity along the x-axis (from east to west in the plane of the sky), spanning from vx = −4000 km s−1 (top left panel) to vx = 3500 km s−1 (bottom right panel). Each frame represents the O-mass density integrated over a 500 km s−1 velocity interval along the x-axis (color bar on the top right of the figure), with the specific interval shown above each frame. Images are saturated at 10% of the maximum value across all frames to enhance visibility. The axes represent the velocity components: vy (LoS velocity, assuming the Earth is located along the negative y-axis) and vz (perpendicular to the LoS, spanning south to north).
Current usage metrics show cumulative count of Article Views (full-text article views including HTML views, PDF and ePub downloads, according to the available data) and Abstracts Views on Vision4Press platform.
Data correspond to usage on the plateform after 2015. The current usage metrics is available 48-96 hours after online publication and is updated daily on week days.
Initial download of the metrics may take a while.