Fig. A.1
Download original image
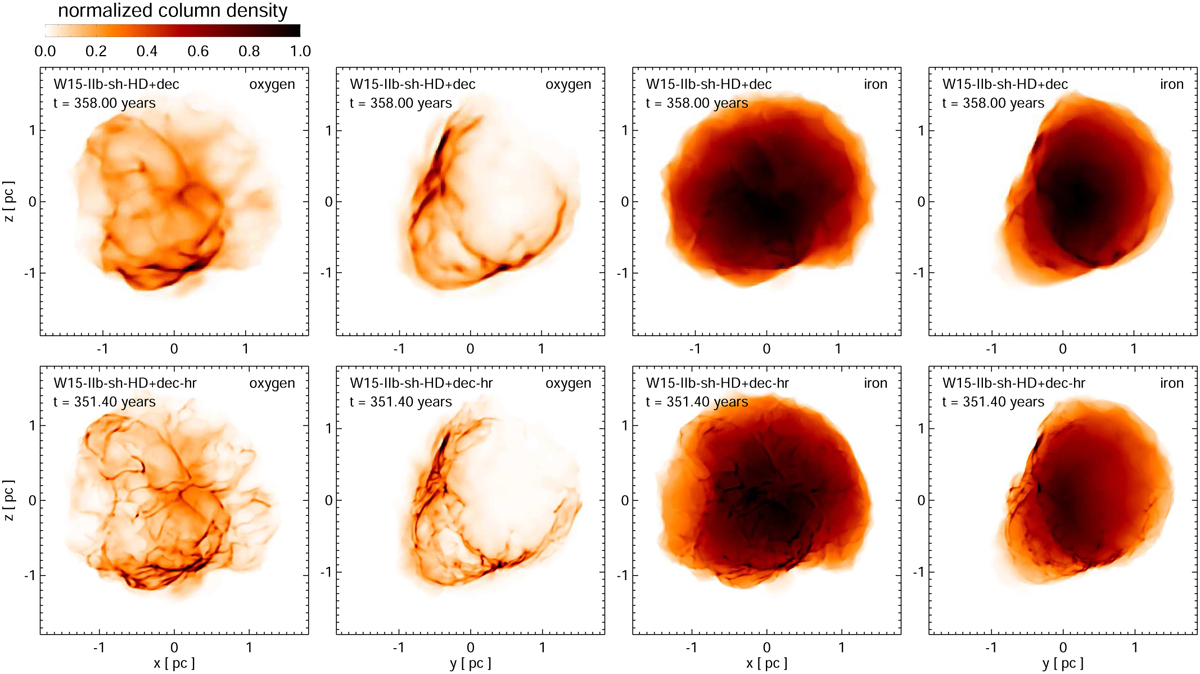
Comparison of two simulations differing only in spatial resolution (see Table 1): run W15-IIb-sh-HD+dec, calculated on a grid with 10243 grid points (upper panels), and run W15-IIb-sh-HD+dec-hr, calculated on a grid with 20483 grid points (lower panels). The figure presents volumetric renderings of the mass density distribution for unshocked O-rich (first two columns on the left) and Fe-rich (last two columns on the right) ejecta, integrated along the LoS, at the age of Cas A. Each image is normalized to its maximum for better visibility (color bar on the top left of the figure). The first and third columns display the volumetric renderings as viewed from Earth’s perspective, corresponding to the negative y-axis (front view). The second and last columns show the renderings from a vantage point along the positive x-axis (side view).
Current usage metrics show cumulative count of Article Views (full-text article views including HTML views, PDF and ePub downloads, according to the available data) and Abstracts Views on Vision4Press platform.
Data correspond to usage on the plateform after 2015. The current usage metrics is available 48-96 hours after online publication and is updated daily on week days.
Initial download of the metrics may take a while.