Fig. 14
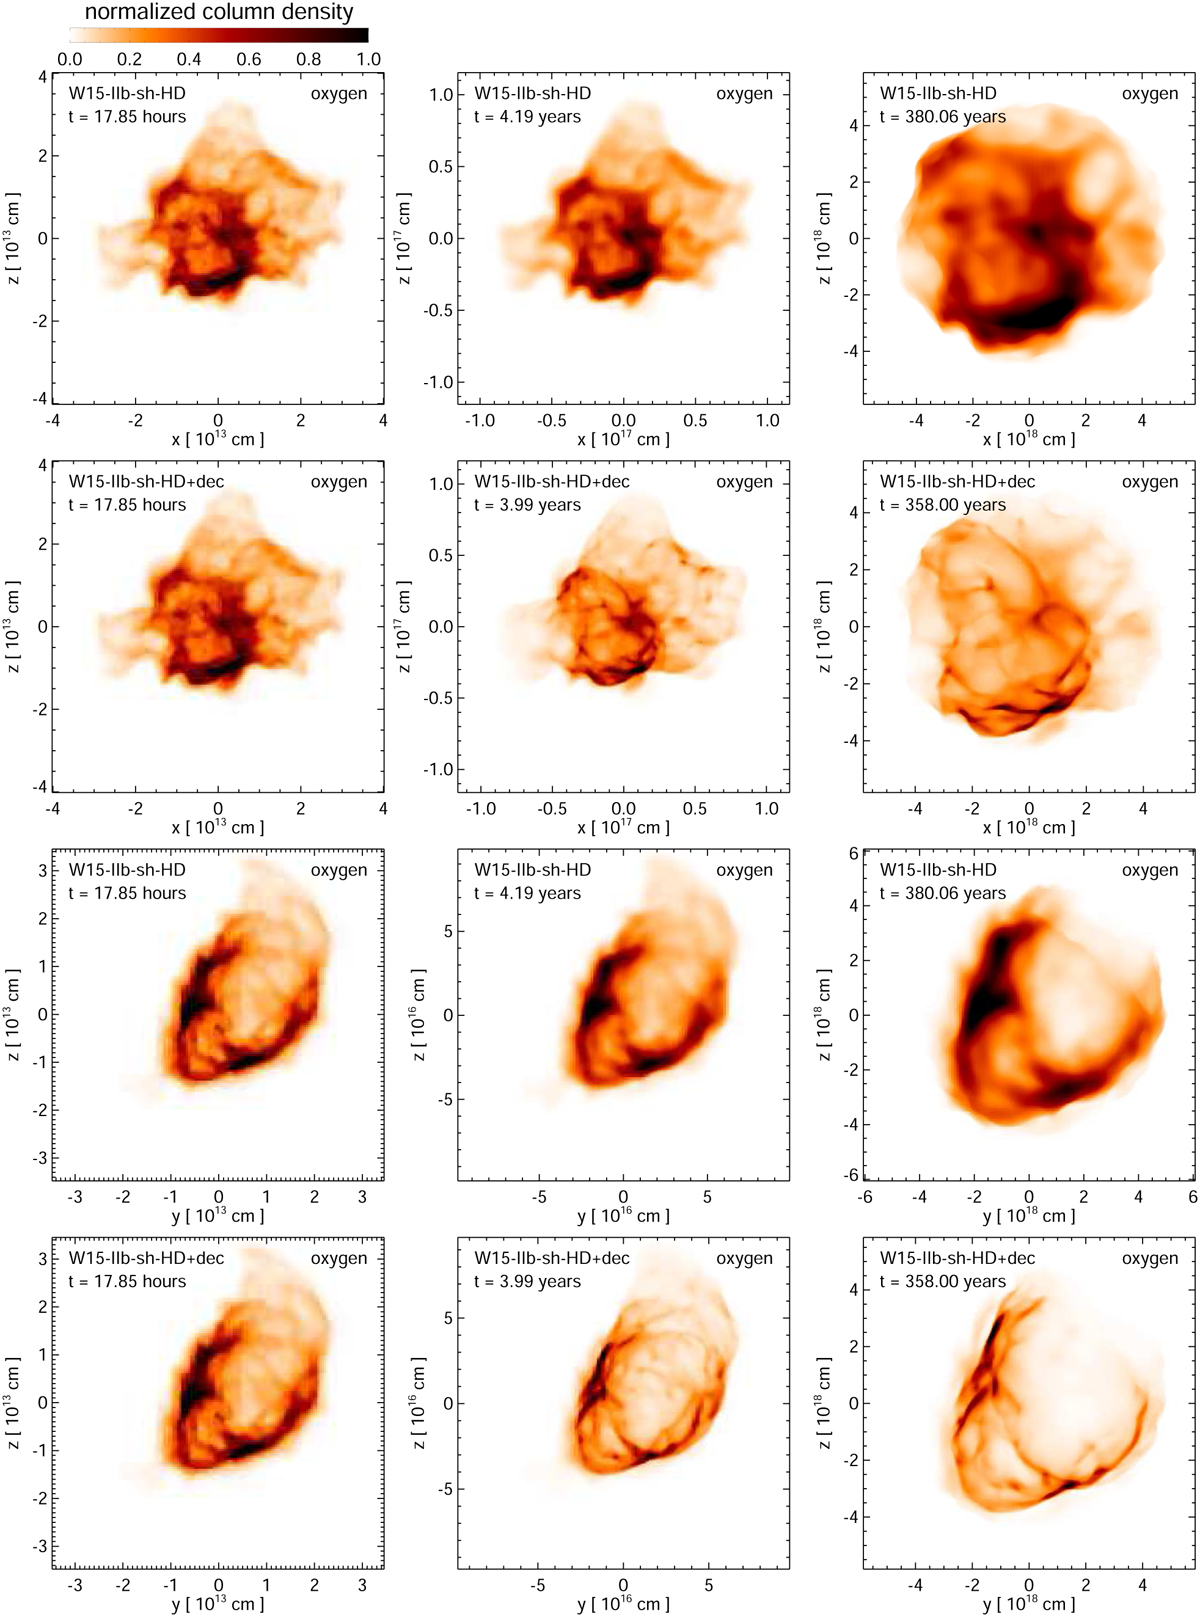
Download original image
Comparison of simulations either with (W15-IIb-sh-HD+dec) or without (W15-IIb-sh-HD) the Ni-bubble effect. The figure presents volumetric renderings of the mass density distribution for unshocked O-rich ejecta, integrated along the LoS, at the labeled times. Each image is normalized to its maximum for better visibility (color bar on the top left of the figure). The first two rows show the simulations from the perspective of Earth, corresponding to the negative y-axis (front view). The last two rows provide the corresponding volume renderings from a vantage point along the positive x-axis (side view).
Current usage metrics show cumulative count of Article Views (full-text article views including HTML views, PDF and ePub downloads, according to the available data) and Abstracts Views on Vision4Press platform.
Data correspond to usage on the plateform after 2015. The current usage metrics is available 48-96 hours after online publication and is updated daily on week days.
Initial download of the metrics may take a while.