Fig. 13
Download original image
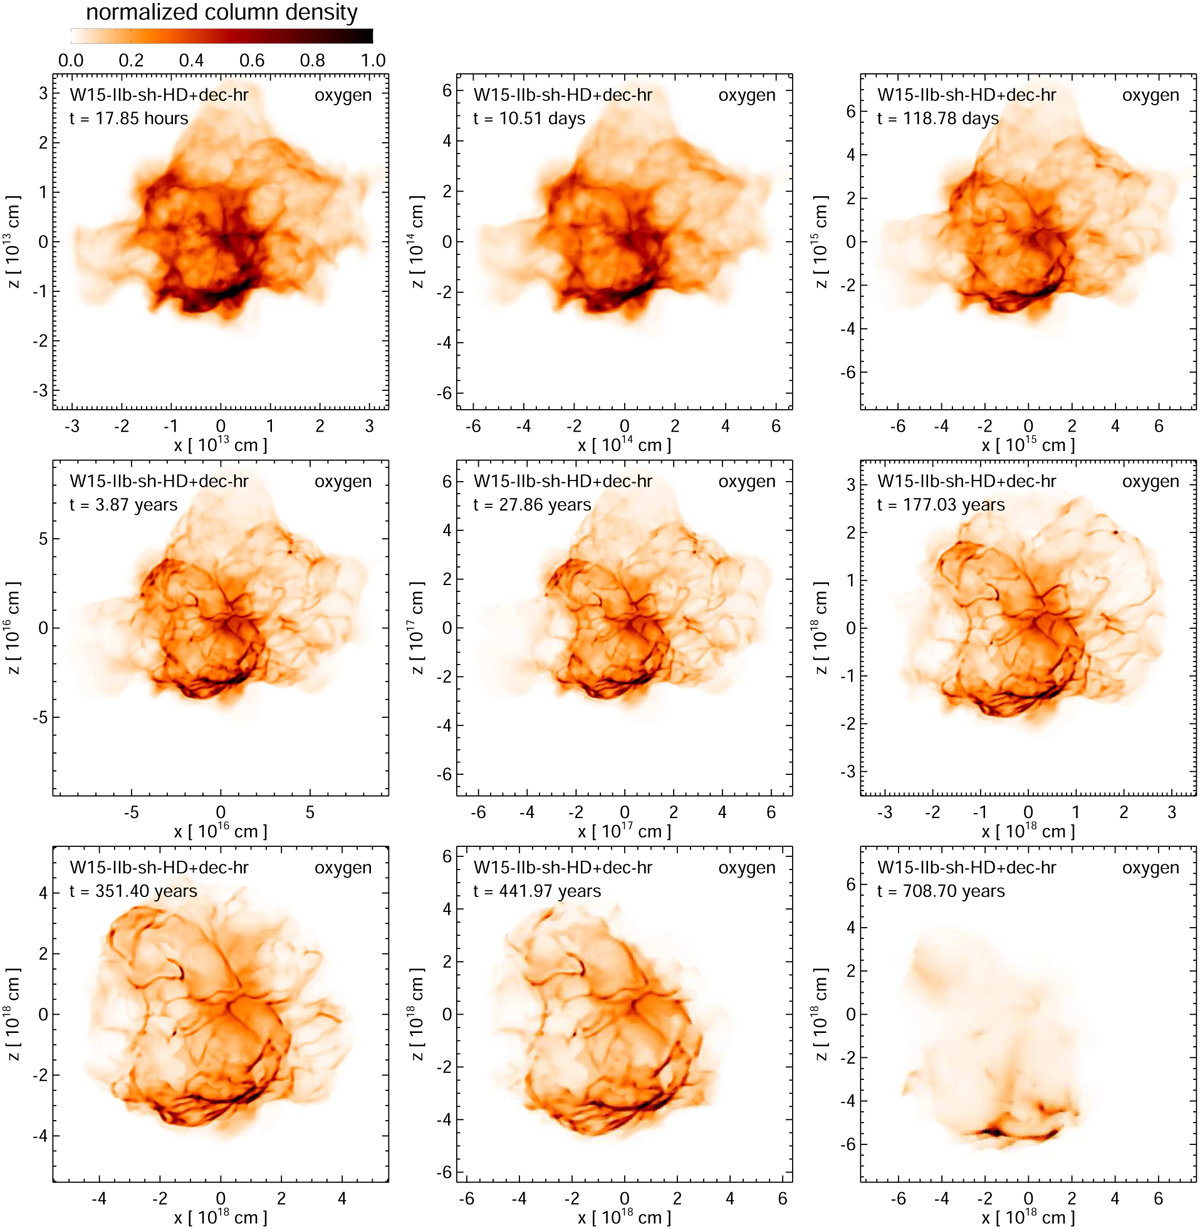
Volume renderings of the mass density distribution for unshocked O-rich ejecta, integrated along the LoS. The images are based on model W15-IIb-sh-HD+dec-hr at the labeled times (indicated in the upper left corner of each panel) and each of them is normalized to its maximum (color bar on the top left of the figure). The perspective assumes a vantage point from Earth, located along the negative y-axis, corresponding to the plane of the sky. See online Movie 2 for an animation of this data.
Current usage metrics show cumulative count of Article Views (full-text article views including HTML views, PDF and ePub downloads, according to the available data) and Abstracts Views on Vision4Press platform.
Data correspond to usage on the plateform after 2015. The current usage metrics is available 48-96 hours after online publication and is updated daily on week days.
Initial download of the metrics may take a while.