Fig. 12
Download original image
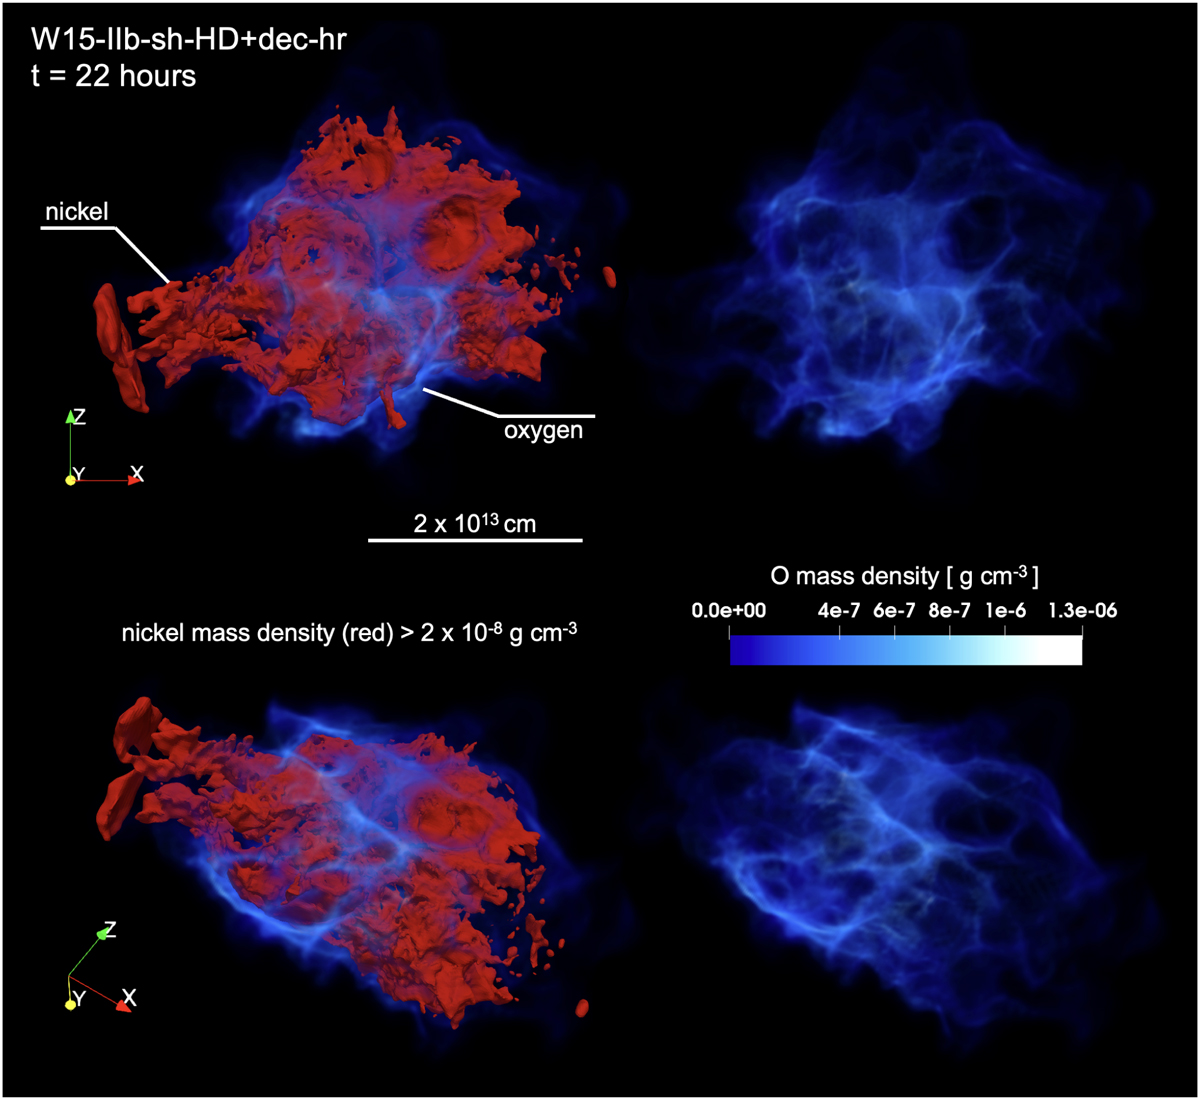
Distribution of unshocked Ni-rich ejecta represented as a red isosurface in the left panels, corresponding to Ni densities exceeding 2 × 10⁻⁸ g cm−3, a few hours after the shock breakout ∼22 hours after the core-collapse, for model W15-IIb-sh-HD+dec-hr. The unshocked O-rich ejecta are shown through volume rendering in a blue color palette, as in Fig. 8. Two perspectives are presented: the upper panels show the front view as seen from Earth, while the lower panels provide the perspective from an arbitrary point of view. A navigable 3D graphic of the O and Ni spatial distribution in this phase is available online and at https://skfb.ly/psXKs.
Current usage metrics show cumulative count of Article Views (full-text article views including HTML views, PDF and ePub downloads, according to the available data) and Abstracts Views on Vision4Press platform.
Data correspond to usage on the plateform after 2015. The current usage metrics is available 48-96 hours after online publication and is updated daily on week days.
Initial download of the metrics may take a while.