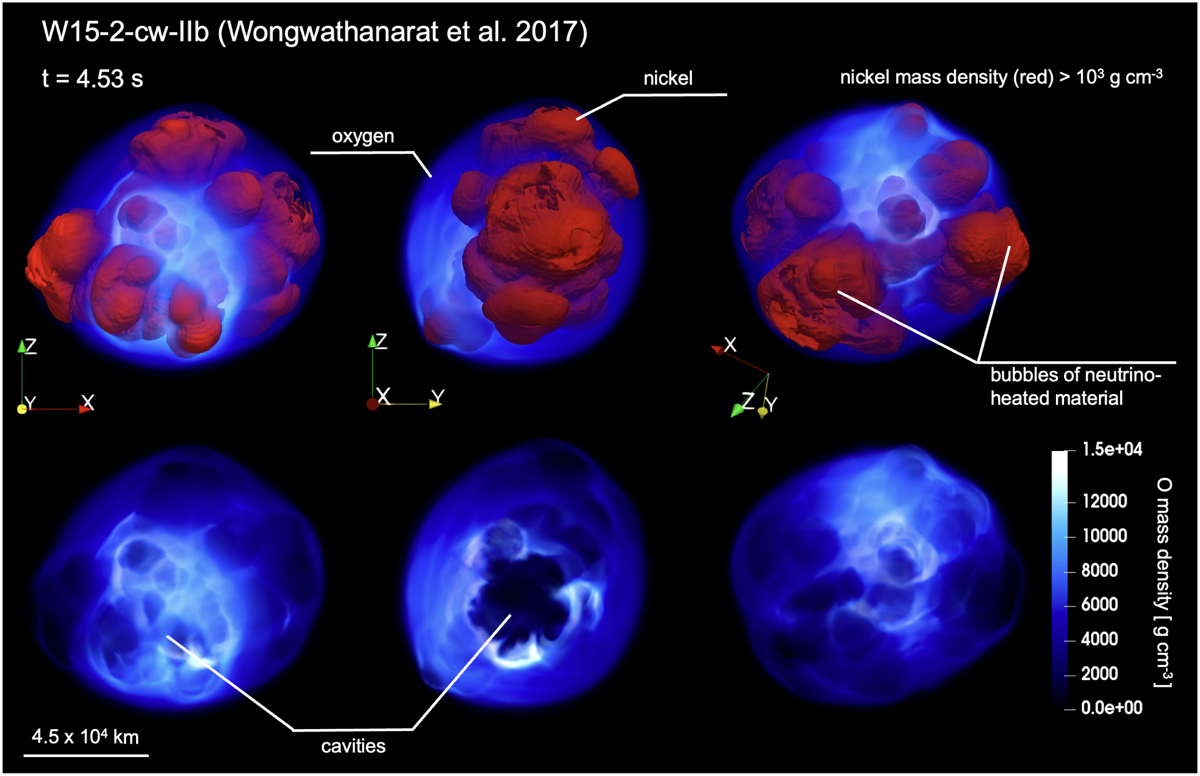
Fig. 11

Download original image
The upper panels display red isosurfaces representing the distribution of Ni-rich ejecta (at a density threshold of 103 g cm−3) at t = 4.53 s after core collapse for model W15-2-cw-IIb (Wongwathanarat et al. 2017), shown from different viewing angles. The corresponding O-rich ejecta are visualized using a blue volume rendering (with opacity scaled to reflect density variations), both in combination with the Ni-rich distribution (upper panels) and independently (lower panels). The bottom right color bar indicates plasma density.
Current usage metrics show cumulative count of Article Views (full-text article views including HTML views, PDF and ePub downloads, according to the available data) and Abstracts Views on Vision4Press platform.
Data correspond to usage on the plateform after 2015. The current usage metrics is available 48-96 hours after online publication and is updated daily on week days.
Initial download of the metrics may take a while.


