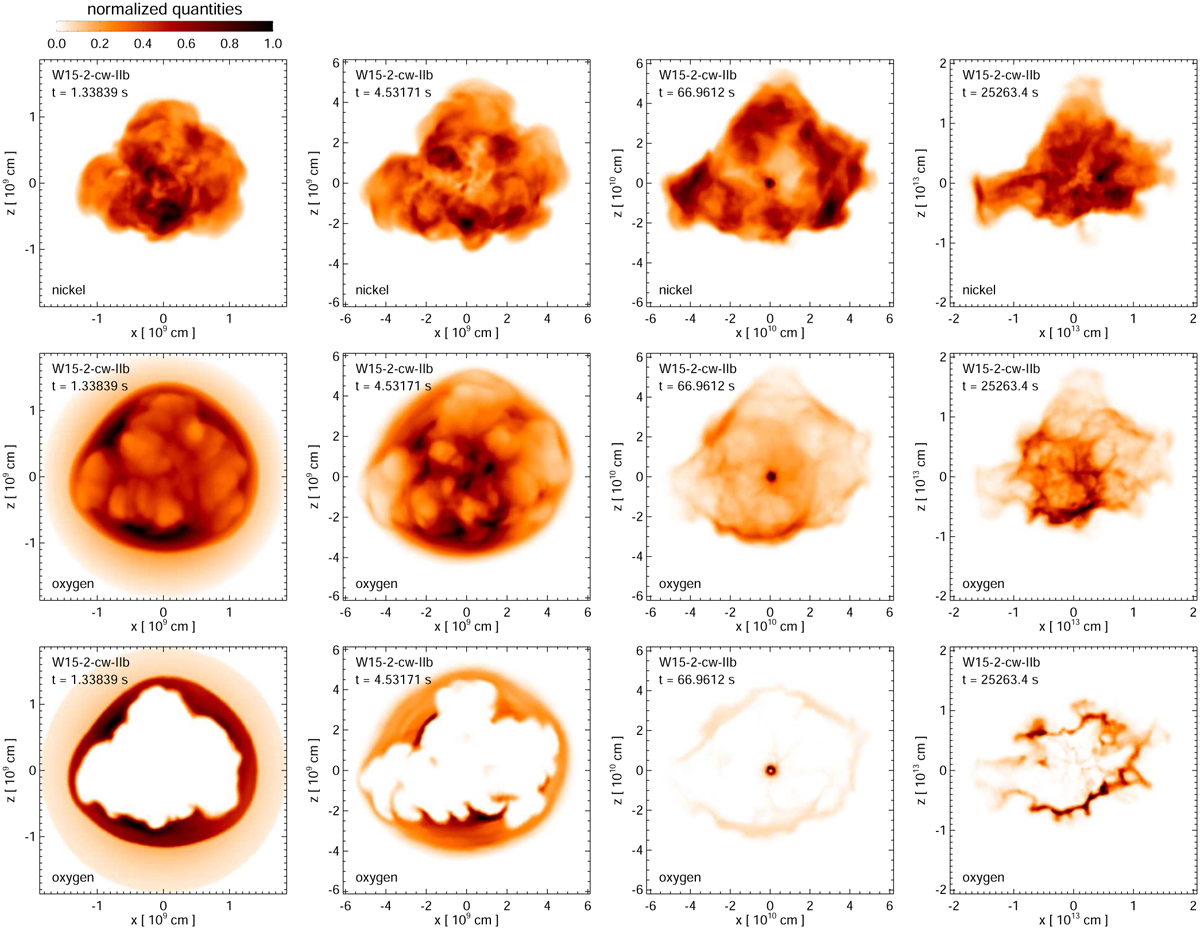
Fig. 10
Download original image
Spatial distributions of Ni and O during the first 7 hours of evolution following core collapse, based on model W15-2-cw-IIb (Wongwathanarat et al. 2017). The upper and middle panels present volumetric renderings of Fe- and O-rich material distributions, respectively, at the specified times. The lower panels display 2D cross-sections of the O-rich ejecta in the [x, z] plane, intersecting the explosion center. Each image is normalized to each maximum for visibility (color bar on the top left of the figure). See online Movie 2 for an animation of these data.
Current usage metrics show cumulative count of Article Views (full-text article views including HTML views, PDF and ePub downloads, according to the available data) and Abstracts Views on Vision4Press platform.
Data correspond to usage on the plateform after 2015. The current usage metrics is available 48-96 hours after online publication and is updated daily on week days.
Initial download of the metrics may take a while.