Fig. 1
Download original image
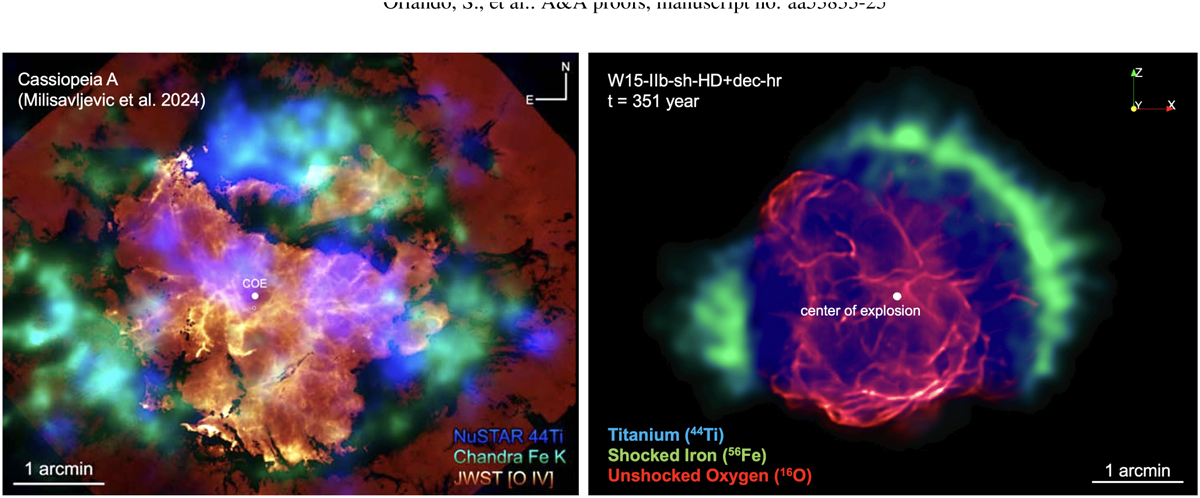
Left panel: composite image (adapted from Fig. 6 in Milisavljevic et al. 2024), combining the NuSTAR 44Ti map (blue), a Chandra Fe-K map (energy ∼6.7 keV; green) with the unshocked ejecta map derived from JWST observations (red). The center of expansion (COE; Thorstensen et al. 2001) and the neutron star are indicated by white and black circles, respectively. Right panel: composite image based on model W15-IIb-sh-HD+dec-hr (see Table 1), showing 3D volumetric renderings of the distributions of 44Ti (blue), shocked 56Fe (green), and unshocked 16O (red). The center of explosion is marked with a white circle. While the model-derived image illustrates the overall geometry of the ejecta, it is not intended to replicate the exact observational appearance.
Current usage metrics show cumulative count of Article Views (full-text article views including HTML views, PDF and ePub downloads, according to the available data) and Abstracts Views on Vision4Press platform.
Data correspond to usage on the plateform after 2015. The current usage metrics is available 48-96 hours after online publication and is updated daily on week days.
Initial download of the metrics may take a while.