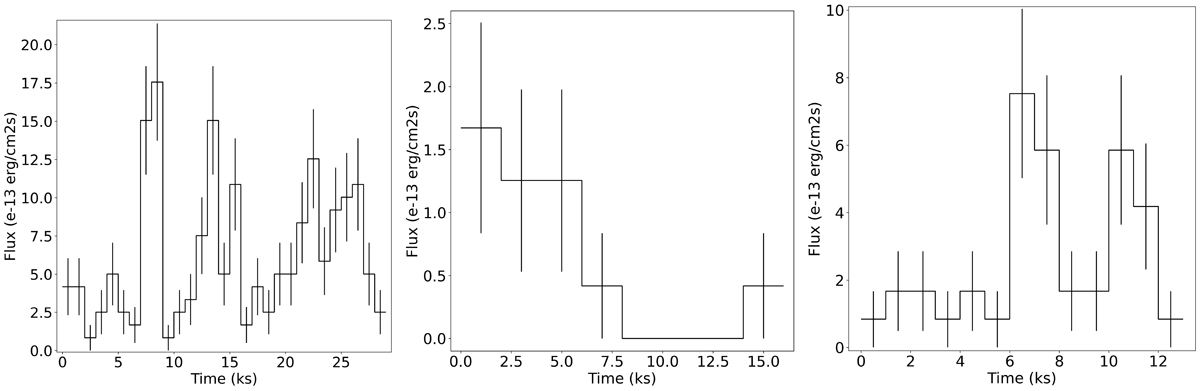
Fig. 5.
Download original image
Chandra flux curves taken in the 2–10 keV energy range. The count rate was converted into 2–12 keV flux using the best-fitted spectrum (see Sect. 3.2). Left panel: observation 6685, 1 ks time bin, and T0 = 274669518; central panel: observation 17440, 2 ks time bin, and T0 = 581548320; right panel: observation 17695, 1 ks time bin, and T0 = 580947681.
Current usage metrics show cumulative count of Article Views (full-text article views including HTML views, PDF and ePub downloads, according to the available data) and Abstracts Views on Vision4Press platform.
Data correspond to usage on the plateform after 2015. The current usage metrics is available 48-96 hours after online publication and is updated daily on week days.
Initial download of the metrics may take a while.