Open Access
Fig. 4.
Download original image
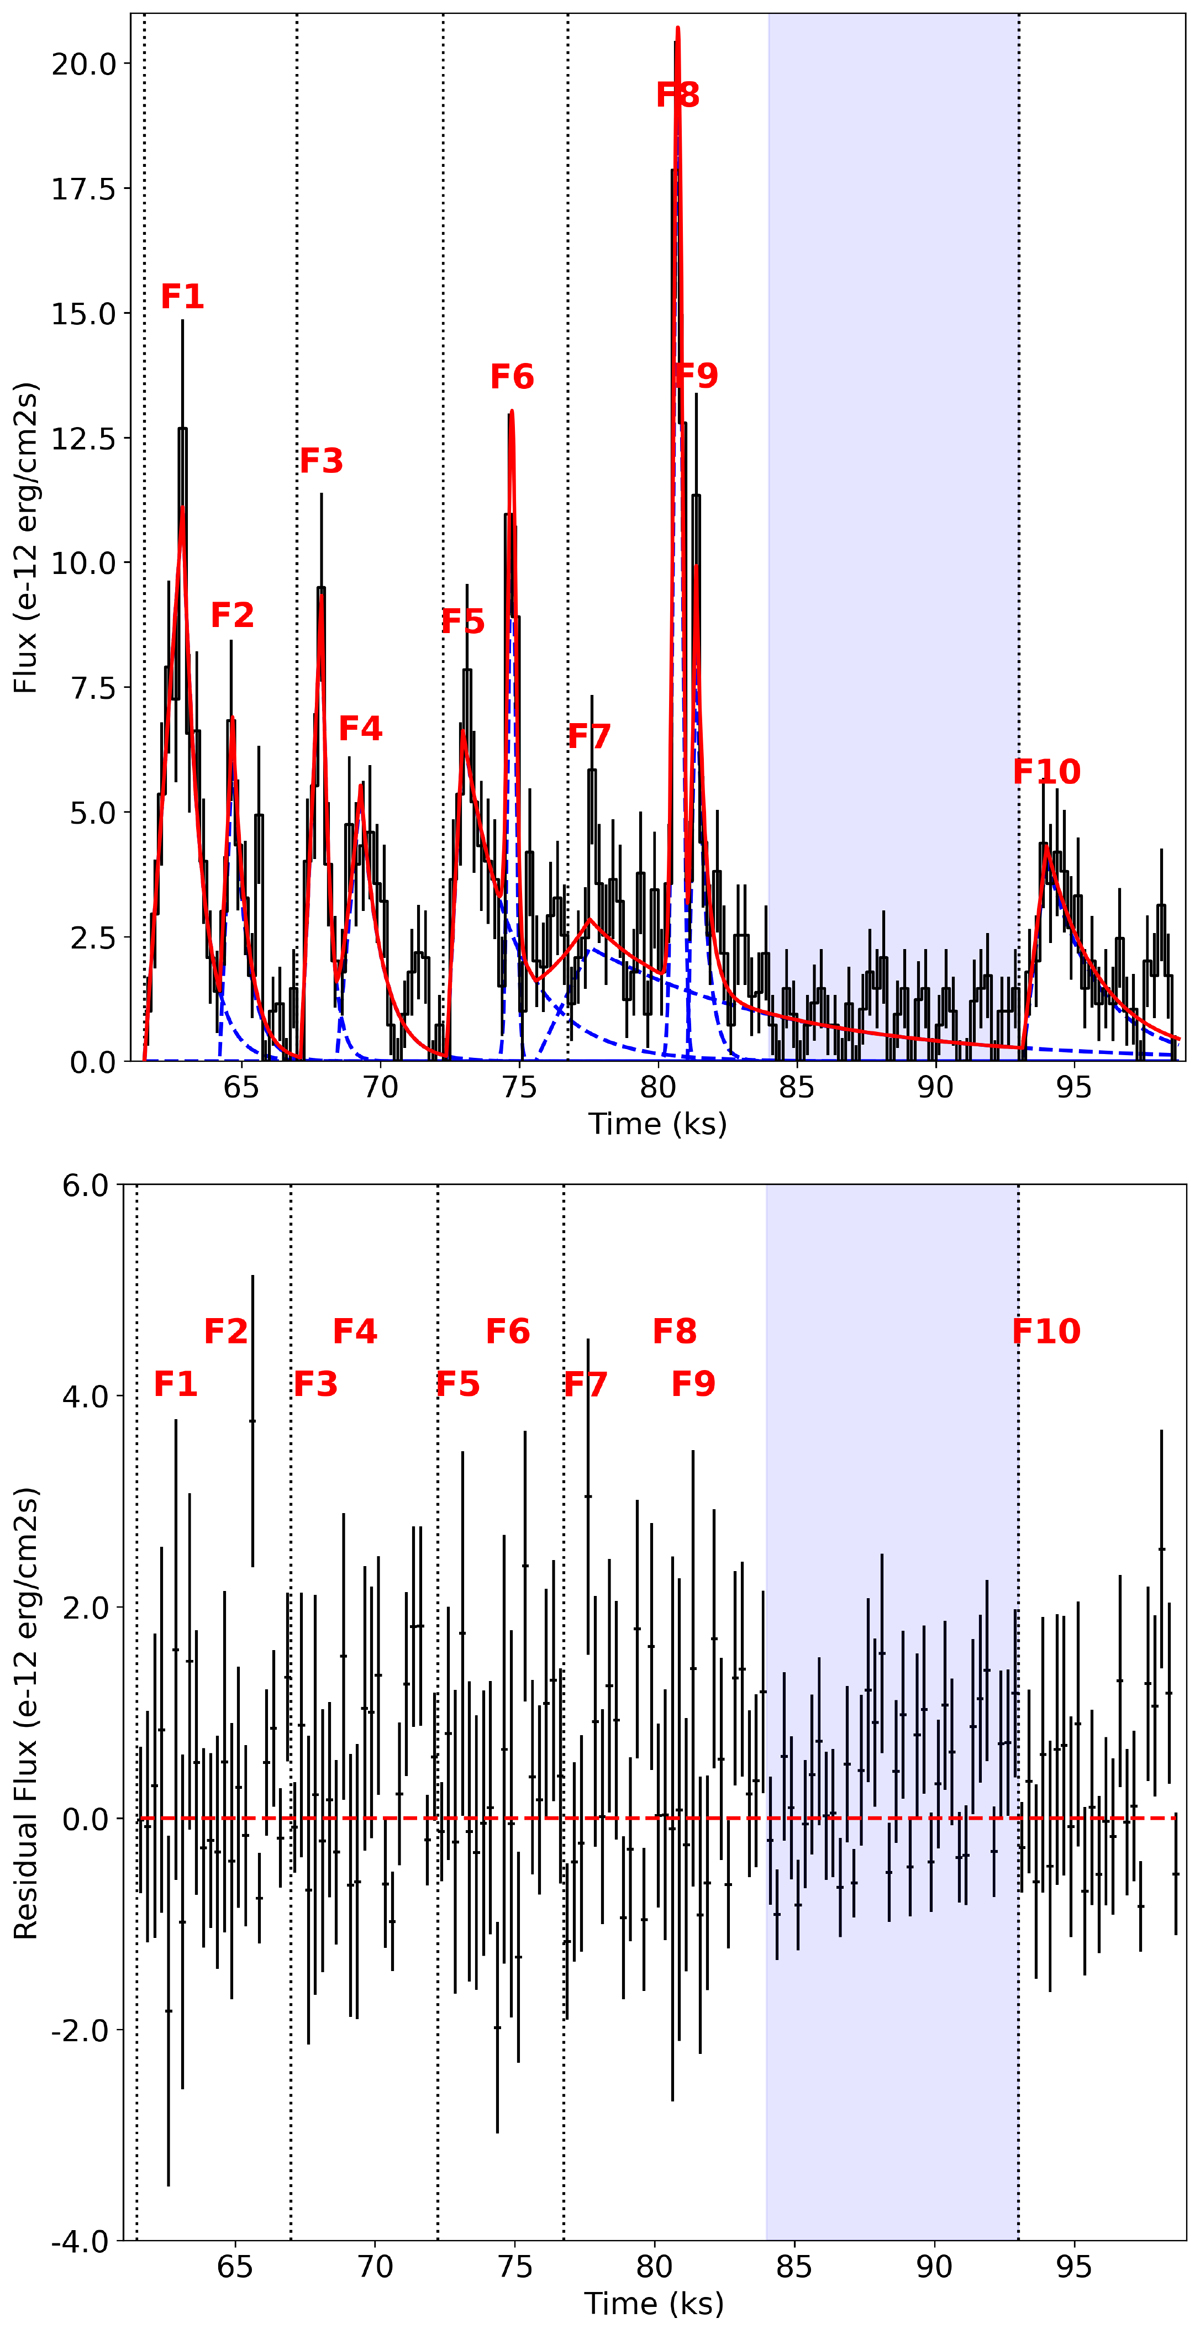
Active part of the XMM-Newton EXTraS flux curve (from T0+61500 s), as in Fig. 3, right panel. Upper panel: flux curve (in black) plus the best-fitted model described in Sect. 3.1 (in red), which is composed of a series of ten different flares (in blue). Lower panel: residual curve of the model reported in the upper panel.
Current usage metrics show cumulative count of Article Views (full-text article views including HTML views, PDF and ePub downloads, according to the available data) and Abstracts Views on Vision4Press platform.
Data correspond to usage on the plateform after 2015. The current usage metrics is available 48-96 hours after online publication and is updated daily on week days.
Initial download of the metrics may take a while.