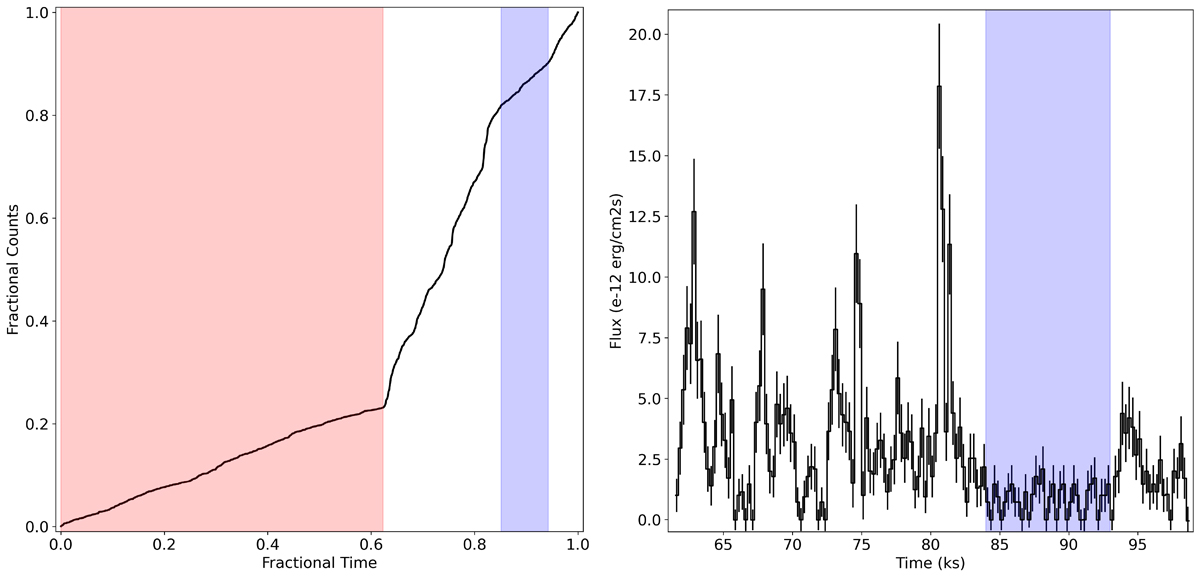
Fig. 3.
Download original image
Left panel: cumulative curve of the events taken from the XMM-Newton region around J1813 in the 2–12 keV energy band and the cuts described in Sect. 2 (we note that it is not background subtracted). The red area marks the quiescent state; the blue area marks the possible active, nonflaring “intermediate” state. Right panel: zoom of the EXTraS flux curve, shown in Fig. 1, with only the active part of the curve (T0+61500 s). The blue area is the same as in the left panel.
Current usage metrics show cumulative count of Article Views (full-text article views including HTML views, PDF and ePub downloads, according to the available data) and Abstracts Views on Vision4Press platform.
Data correspond to usage on the plateform after 2015. The current usage metrics is available 48-96 hours after online publication and is updated daily on week days.
Initial download of the metrics may take a while.