Open Access
Fig. 9.
Download original image
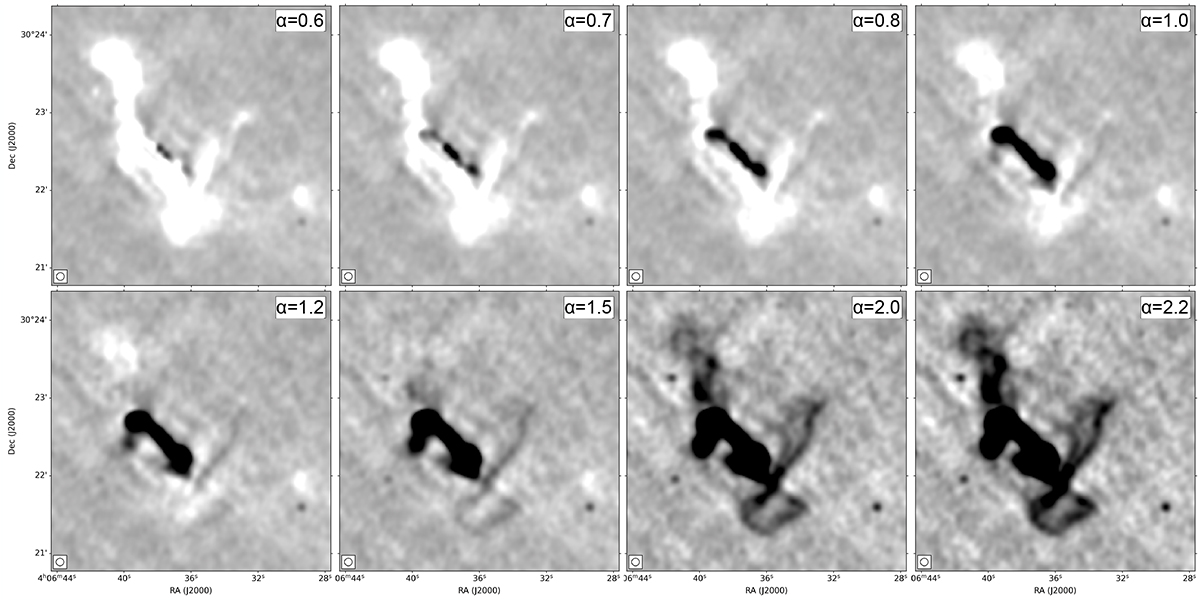
Spectral tomography of the inner lobes in the frequency range 400−1518 MHz at 6 arcsec resolution. The white emission is steeper than the reference α value reported in the top right corner of each panel, while the black emission is flatter.
Current usage metrics show cumulative count of Article Views (full-text article views including HTML views, PDF and ePub downloads, according to the available data) and Abstracts Views on Vision4Press platform.
Data correspond to usage on the plateform after 2015. The current usage metrics is available 48-96 hours after online publication and is updated daily on week days.
Initial download of the metrics may take a while.