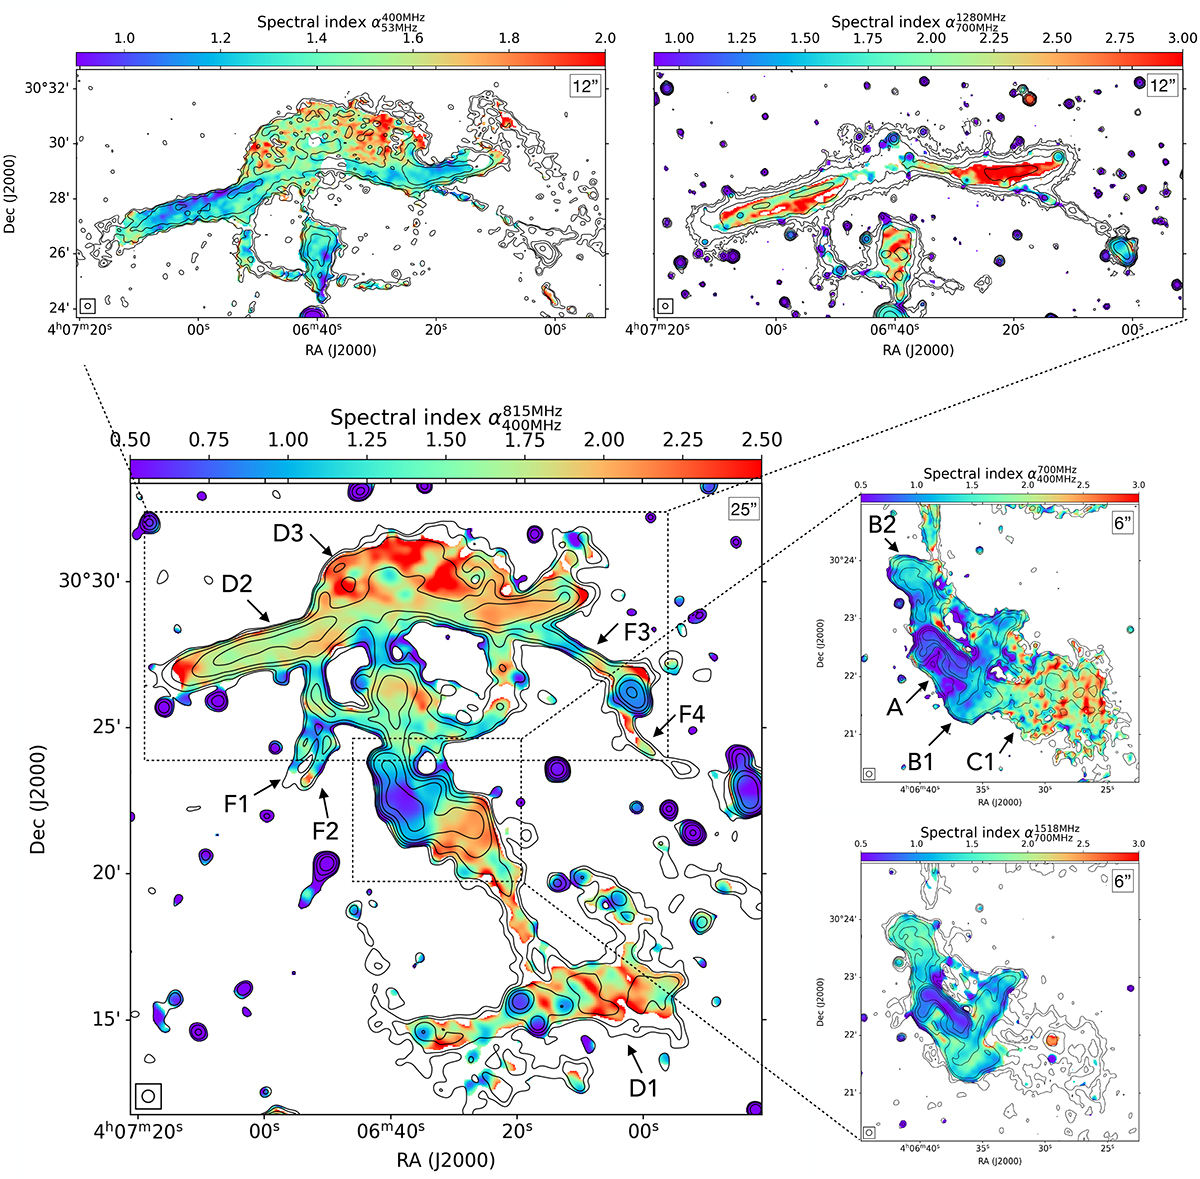
Fig. 6.
Download original image
Spectral index maps of Nest200047, as described in Sect. 3.2. Central panel: Spectral index map of the entire source between 400−815 MHz with a resolution of 25 arcsec. Top panels: Spectral index maps of the northern bubbles between frequencies 53−400 MHz (left) and 700−1280 MHz (right), with a resolution of 12 arcsec. Right panels: Spectral index maps of the central jets–bubbles between 400−700 MHz (top) and 700−1518 MHz (bottom), with a resolution of 6 arcsec. The black contours always trace the emission at the lowest frequency included in the map starting from 3σ.
Current usage metrics show cumulative count of Article Views (full-text article views including HTML views, PDF and ePub downloads, according to the available data) and Abstracts Views on Vision4Press platform.
Data correspond to usage on the plateform after 2015. The current usage metrics is available 48-96 hours after online publication and is updated daily on week days.
Initial download of the metrics may take a while.