Fig. 15.
Download original image
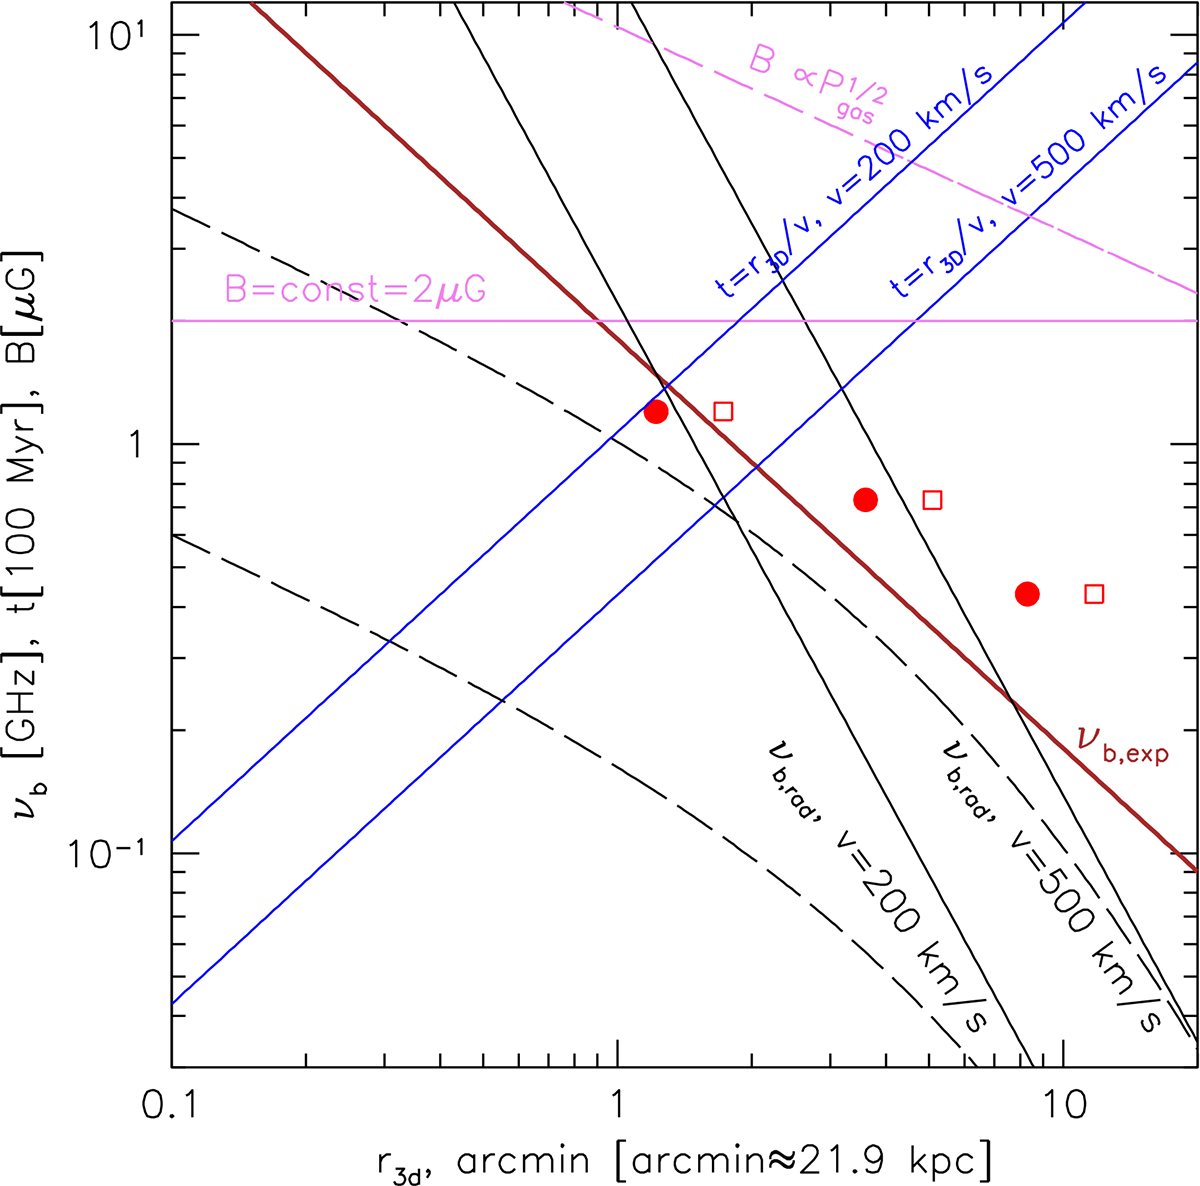
Comparison of observed (red symbols) and expected break frequencies for regions B, C, and D3 as a function of their 3D radial distances (r3D) from the cluster core. Two cases are shown: the solid circles and open squares correspond to r3D = rproj and ![]() , respectively. The brown curve shows the shift of the break frequency with distance due to pure adiabatic losses with
, respectively. The brown curve shows the shift of the break frequency with distance due to pure adiabatic losses with ![]() . The two blue lines show the characteristic dwell time (in units of 108 yr) of a bubble at a given radius for two values of the bubble velocity. The black lines show the estimated break frequencies due to radiative losses for these velocities. The solid line is for constant B and the dashed line is for
. The two blue lines show the characteristic dwell time (in units of 108 yr) of a bubble at a given radius for two values of the bubble velocity. The black lines show the estimated break frequencies due to radiative losses for these velocities. The solid line is for constant B and the dashed line is for ![]() . The corresponding radial dependencies of B are shown with the solid and dashed magenta lines for a constant and declining magnetic field, respectively.
. The corresponding radial dependencies of B are shown with the solid and dashed magenta lines for a constant and declining magnetic field, respectively.
Current usage metrics show cumulative count of Article Views (full-text article views including HTML views, PDF and ePub downloads, according to the available data) and Abstracts Views on Vision4Press platform.
Data correspond to usage on the plateform after 2015. The current usage metrics is available 48-96 hours after online publication and is updated daily on week days.
Initial download of the metrics may take a while.