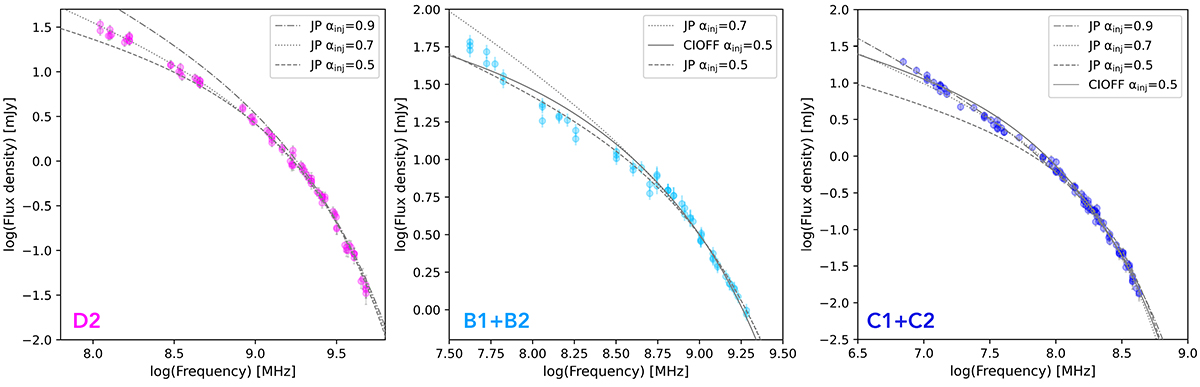
Fig. 13.
Download original image
Global spectra in the frequency range 54−1518 MHz for three different regions of the source Nest200047 (D2, C1/C2, and B1/B2) including flux densities at 53 MHz, 144 MHz, 400 MHz, 700 MHz, 815 MHz, 1280 MHz, and 1518 MHz. The blue points represent boxes drawn in region C1/C2, the magenta points in region D2, and the cyan points in B1/B2, as shown in Fig. 12. The lines represent various spectral models as a reference.
Current usage metrics show cumulative count of Article Views (full-text article views including HTML views, PDF and ePub downloads, according to the available data) and Abstracts Views on Vision4Press platform.
Data correspond to usage on the plateform after 2015. The current usage metrics is available 48-96 hours after online publication and is updated daily on week days.
Initial download of the metrics may take a while.