Fig. 12.
Download original image
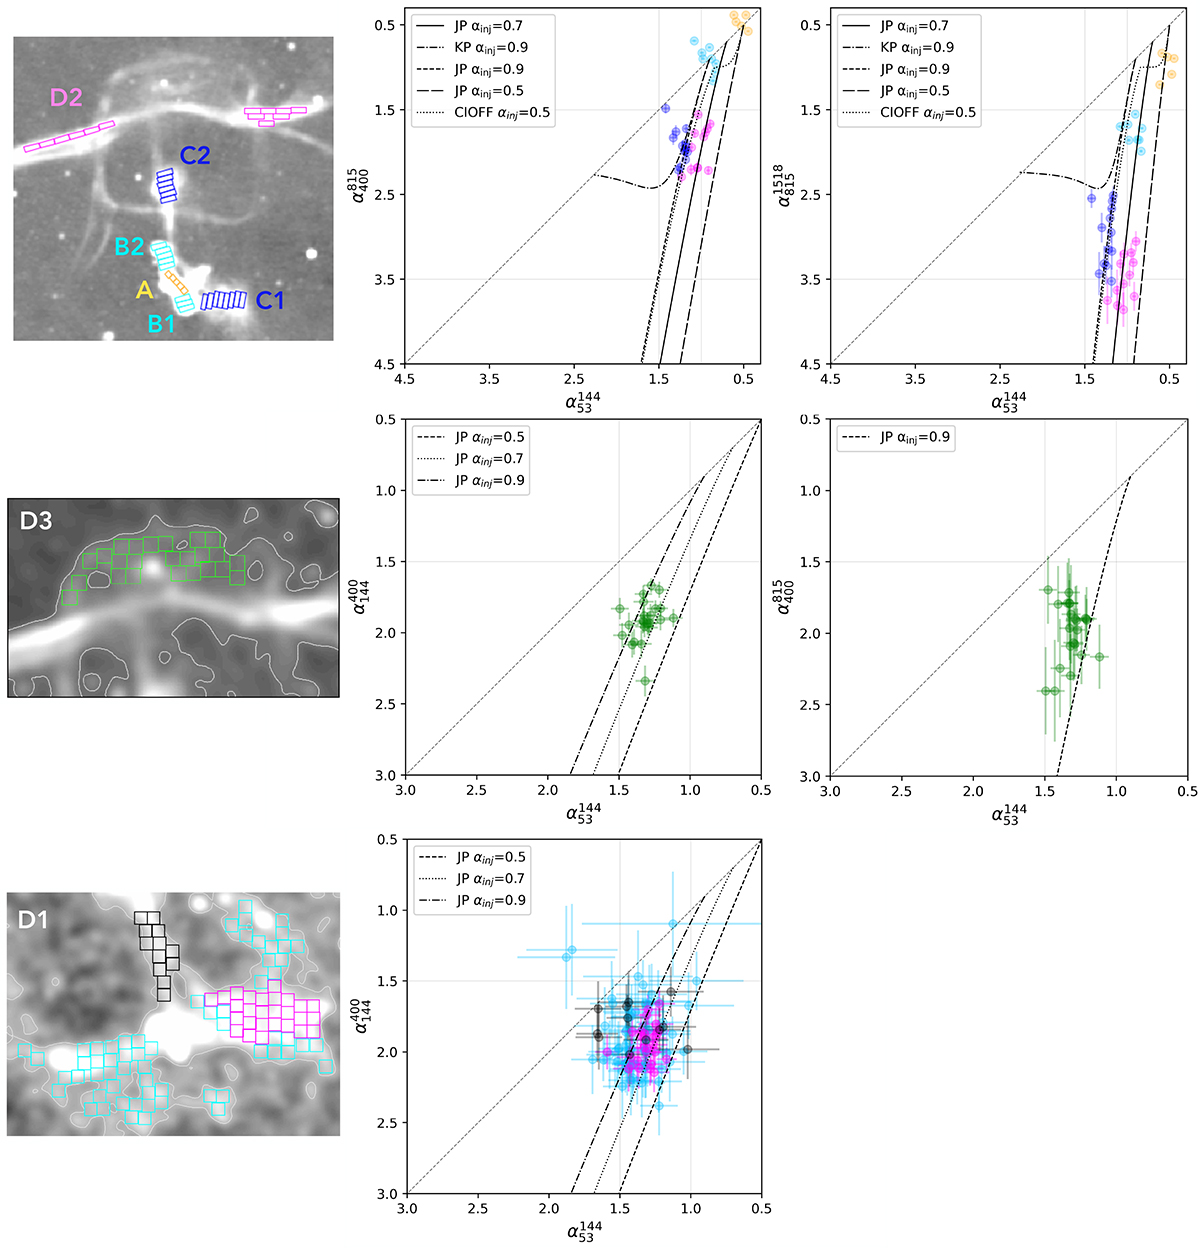
Colour-colour plots for different regions across Nest200047 and over different frequencies. The top row shows ![]() vs
vs ![]() and
and ![]() vs
vs ![]() for regions D2 (magenta points), C1/C2 (blue points), B1/B2 (cyan points), and A (yellow points). Images at 12 arcsec resolution were used for the measurements. The boxes used (one-beam area for region A and three beam-area for the other regions), colour-coded according to the different regions, are shown in the top left panel. The middle row shows
for regions D2 (magenta points), C1/C2 (blue points), B1/B2 (cyan points), and A (yellow points). Images at 12 arcsec resolution were used for the measurements. The boxes used (one-beam area for region A and three beam-area for the other regions), colour-coded according to the different regions, are shown in the top left panel. The middle row shows ![]() vs
vs ![]() (middle) and
(middle) and ![]() vs
vs ![]() (left) for D3 (green points). The bottom row shows
(left) for D3 (green points). The bottom row shows ![]() vs
vs ![]() for the southern large-scale region, including D1, the bridge, and the diffuse emission. For the plots shown in the middle and bottom row, images at 25 arcsec were used for the measurements. The boxes used (one-beam area), colour-coded according to the different regions, are shown in the left panels of each row. In all plots the dashed line represents the bisector line (where αhigh = αlow), the other lines represent various ageing models as a reference.
for the southern large-scale region, including D1, the bridge, and the diffuse emission. For the plots shown in the middle and bottom row, images at 25 arcsec were used for the measurements. The boxes used (one-beam area), colour-coded according to the different regions, are shown in the left panels of each row. In all plots the dashed line represents the bisector line (where αhigh = αlow), the other lines represent various ageing models as a reference.
Current usage metrics show cumulative count of Article Views (full-text article views including HTML views, PDF and ePub downloads, according to the available data) and Abstracts Views on Vision4Press platform.
Data correspond to usage on the plateform after 2015. The current usage metrics is available 48-96 hours after online publication and is updated daily on week days.
Initial download of the metrics may take a while.